Category:Demographics of Germany
Pereiti į navigaciją
Jump to search
Europos valstybės: Airija · Albanija · Andora · Armėnija‡ · Austrija · Azerbaidžanas‡ · Baltarusija · Belgija · Bosnija ir Hercegovina · Bulgarija · Čekija · Danija · Estija · Graikija · Gruzija‡ · Islandija · Ispanija‡ · Italija · Jungtinė Karalystė · Juodkalnija · Kazachstanas‡ · Kipras‡ · Kroatija · Latvija · Lenkija · Lichtenšteinas · Lietuva · Liuksemburgas · Malta · Moldavija · Monakas · Norvegija · Nyderlandai‡ · Portugalija‡ · Prancūzija‡ · Rumunija · Rusija‡ · San Marinas · Serbija · Slovakija · Slovėnija · Suomija · Šiaurės Makedonija · Švedija · Šveicarija · Turkija‡ · Ukraina · Vengrija · Vokietija
Konkrečias statusas: Farerai · Džersis · Gibraltaras · Gernsis · Meno Sala – Ribotas pripažinimas: Kosovas
‡: partly located in Europe
Konkrečias statusas: Farerai · Džersis · Gibraltaras · Gernsis · Meno Sala – Ribotas pripažinimas: Kosovas
‡: partly located in Europe
demographics of country | |||||
| Įkelti mediją | |||||
| Tai yra |
| ||||
|---|---|---|---|---|---|
| Poklasis | |||||
| Vieta | Vokietija | ||||
| |||||
Subkategorijos
Rodoma 17 subkategorijų (iš viso yra 17 subkategorijų).
Puslapiai kategorijoje „Demographics of Germany“
Šioje kategorijoje yra vienas puslapis.
Daugialypės terpės rinkmenos kategorijoje „Demographics of Germany“
Rodomi 56 šios kategorijos rinkmenos (iš viso kategorijoje yra 56 rinkmenos).
-
 Akademikerquote 1975-2000 Deutschland.png 556 × 318; 10 KiB
-
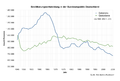
 Altersspezifische Sterberaten Deutschland.svg 540 × 360; 143 KiB
-
 Anteil der 20- bis 35-Jährigen (2011).svg 9 463 × 12 526; 2,58 MiB
-
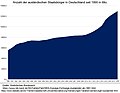 Anzahl der ausländischen Staatsbürger in Deutschland seit 1990.jpg 1 038 × 804; 118 KiB
-
 Bevoelkerungsentwicklung deutschland.png 2 150 × 1 450; 122 KiB
-
 BevTeichdf.png 648 × 165; 7 KiB
-
 Bevölkerung absolut 1940 - 2011 Wennigsen.png 1 457 × 726; 38 KiB
-
 Bevölkerungsentwicklung Deutscher Großstädte seit 1990.svg 904 × 1 470; 494 KiB
-
 Bevölkerungsentwicklung Deutscher Großstädte seit 1990.png 634 × 980; 47 KiB
-
 Bevölkerungsentwicklung Deutschland.svg 1 350 × 810; 71 KiB
-
 BirthDeath 1950 DE.svg 480 × 280; 8 KiB
-
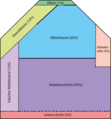 Dahrendorfhaus.png 2 038 × 2 194; 116 KiB
-
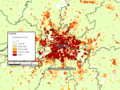 Dasy berlin brandenburg.png 1 043 × 782; 51 KiB
-
 Demographic-Transition-5-countries.png 2 999 × 2 025; 413 KiB
-
 Demographic trends in France and Germany- implications for U.S. national security (IA demographictrend1094532009).pdf 1 275 × 1 650, 109 puslapiai; 4,38 MiB
-
 Entwicklung Jüdische Gemeinde Kassel.png 975 × 751; 110 KiB
-
 Fertility Rates by Wedding Year Germany 1900-1945.JPG 595 × 480; 124 KiB
-
 Altersspezifische Fruchtbarkeitsziffern in Deutschland.png 389 × 305; 12 KiB
-
 Germans without a migrant background (2016).svg 1 351 × 1 934; 1,85 MiB
-
 Germany foreigners as percentage of population.png 5 825 × 6 465; 1,1 MiB
-
 Germany migrant percentage by age.jpg 1 067 × 583; 155 KiB
-
 Germany population pyramid (2018).jpg 610 × 425; 30 KiB
-
 Germany-bundeslander-11-fa.svg 509 × 289; 18 KiB
-
 Germany-imag-fa.svg 289 × 289; 8 KiB
-
 Germany-under-five-mortality.svg 1 080 × 720; 27 KiB
-
 Heiratsalter lediger Frauen in Deutschland 1910-2013.png 729 × 484; 124 KiB
-
 Historical population of Germany.svg 850 × 600; 48 KiB
-
 Immigration Germany 1990-2020.png 2 047 × 1 130; 136 KiB
-
 Kinderzahl pro Ehe pro Heiratsjahr Deutschland 1900-1972.png 747 × 489; 75 KiB
-
 Kinderzahl pro Haushalt mit minderjaehrigen Kindern Deutschland 2011.png 675 × 486; 67 KiB
-
 Kohortenfertilität Deutschland 1856-1975.png 586 × 483; 84 KiB
-
 Matrix 2015.png 97 × 60; 10 KiB
-
 Matrix A.png 498 × 156; 21 KiB
-
 Mittleres Erstgeburtsalter verheirateter Frauen in Deutschland 1960-2013.png 633 × 486; 102 KiB
-
 Mk Bevölkerung Bundesländer Zahlen.png 798 × 414; 16 KiB
-
 Mk Bevölkerungsentwicklung.png 737 × 467; 12 KiB
-
 Mk Natürliche Bevölkerungsentwicklung.png 510 × 315; 5 KiB
-
 Mk Wanderungssaldo.png 740 × 465; 11 KiB
-
 Mk Wanderungsstatistik.png 850 × 259; 14 KiB
-
 One parent with migration background age structure in Germany in 2021.svg 2 796 × 2 014; 26 KiB
-
 Population Development Germany.svg 1 350 × 810; 65 KiB
-
 Religion in Nazi-Germany 1939 census.png 1 016 × 1 014; 43 KiB
-
 Riesa Einwentw.png 665 × 405; 25 KiB
-
 RNI 1950 DE.svg 480 × 264; 7 KiB
-
 Salario medio annuo in dollari.png 868 × 568; 64 KiB
-
 Statistik Leimersheim Bevoelkerung.png 880 × 411; 6 KiB
-
 Steska vlajka.jpg 3 508 × 2 464; 8,27 MiB
-
 Total fertility rate of Germany overtime to 2016.svg 850 × 600; 43 KiB
-
 UNECE Germany 2010.gif 429 × 615; 23 KiB
-
 Unemployment rate in Germany (%), 2001-2021 (HY).png 1 234 × 539; 62 KiB
-
 Versorgungsquote Kinderkrippen.png 763 × 482; 118 KiB
-
 Wanderungsbilanz 1991-2013.png 864 × 442; 39 KiB
-
 With migration background age structure in Germany in 2021.svg 2 796 × 2 014; 25 KiB
-
 Without migration background age structure in Germany in 2021.svg 2 796 × 2 014; 26 KiB
-
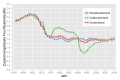 Zusammengefasste Fruchtbarkeitsziffer Deutschland.svg 540 × 360; 147 KiB
-
 Естественное движение Германии (на 1000 чел).png 1 522 × 740; 70 KiB


.svg)


.svg)


.jpg)


,_2001-2021_(HY).png)


.png)