Category:Demographics of Switzerland
Jump to navigation
Jump to search
Countries of Europe: Albania · Andorra · Armenia‡ · Austria · Azerbaijan‡ · Belarus · Belgium · Bosnia and Herzegovina · Bulgaria · Croatia · Cyprus‡ · Czech Republic · Denmark · Estonia · Finland · France‡ · Georgia‡ · Germany · Greece · Hungary · Iceland · Republic of Ireland · Italy · Kazakhstan‡ · Latvia · Liechtenstein · Lithuania · Luxembourg · Malta · Moldova · Monaco · Montenegro · Netherlands‡ · North Macedonia · Norway · Poland · Portugal‡ · Romania · Russia‡ · San Marino · Serbia · Slovakia · Slovenia · Spain‡ · Sweden · Switzerland · Turkey‡ · Ukraine · United Kingdom
Specific status: Faroe Islands · Gibraltar · Bailiwick of Guernsey · Isle of Man · Jersey – Limited recognition: Kosovo
‡: partly located in Europe
Specific status: Faroe Islands · Gibraltar · Bailiwick of Guernsey · Isle of Man · Jersey – Limited recognition: Kosovo
‡: partly located in Europe
demographics of country | |||||
| Upload media | |||||
| Instance of |
| ||||
|---|---|---|---|---|---|
| Subclass of | |||||
| Location | Switzerland | ||||
| |||||
Subcategories
This category has the following 13 subcategories, out of 13 total.
Media in category "Demographics of Switzerland"
The following 96 files are in this category, out of 96 total.
-
 Archiv.stat.jahrbuecher.jpg 700 × 220; 65 KB
-
 Bevoelkerungsentwicklung der Schweiz von 1861 bis 2014.png 825 × 462; 14 KB
-
 Bevölkerungsentwicklung Raperswilen TG Diagramm.png 978 × 669; 13 KB
-
 Bevölkerungsentwicklung Schweiz.svg 1,350 × 810; 78 KB
-
 BirthDeath 1950 CH.svg 480 × 280; 8 KB
-
 Deaths over time 1981-2020 AR-en.png 3,600 × 3,000; 86 KB
-
 Deaths over time 1981-2020 AR-it.png 3,600 × 3,000; 87 KB
-
 Demandes d'asile en Suisse.png 593 × 294; 28 KB
-
 Demographics age groups over time 1981-2020 AG-en.svg 1,080 × 900; 11 KB
-
 Demographics age groups over time 1981-2020 AG-it.svg 1,080 × 900; 11 KB
-
 Demographics age groups over time 1981-2020 AI-en.svg 1,080 × 900; 11 KB
-
 Demographics age groups over time 1981-2020 AI-it.svg 1,080 × 900; 11 KB
-
 Demographics age groups over time 1981-2020 AR-en.svg 1,080 × 900; 11 KB
-
 Demographics age groups over time 1981-2020 AR-it.svg 1,080 × 900; 11 KB
-
 Demographics age groups over time 1981-2020 BE-en.svg 1,080 × 900; 11 KB
-
 Demographics age groups over time 1981-2020 BE-it.svg 1,080 × 900; 11 KB
-
 Demographics age groups over time 1981-2020 BL-en.svg 1,080 × 900; 11 KB
-
 Demographics age groups over time 1981-2020 BL-it.svg 1,080 × 900; 11 KB
-
 Demographics age groups over time 1981-2020 BS-en.svg 1,080 × 900; 12 KB
-
 Demographics age groups over time 1981-2020 BS-it.svg 1,080 × 900; 12 KB
-
 Demographics age groups over time 1981-2020 CH-en.svg 1,080 × 900; 11 KB
-
 Demographics age groups over time 1981-2020 CH-it.svg 1,080 × 900; 11 KB
-
 Demographics age groups over time 1981-2020 FR-en.svg 1,080 × 900; 11 KB
-
 Demographics age groups over time 1981-2020 FR-it.svg 1,080 × 900; 11 KB
-
 Demographics age groups over time 1981-2020 GE-en.svg 1,080 × 900; 11 KB
-
 Demographics age groups over time 1981-2020 GE-it.svg 1,080 × 900; 11 KB
-
 Demographics age groups over time 1981-2020 GL-en.svg 1,080 × 900; 11 KB
-
 Demographics age groups over time 1981-2020 GL-it.svg 1,080 × 900; 11 KB
-
 Demographics age groups over time 1981-2020 GR-en.svg 1,080 × 900; 11 KB
-
 Demographics age groups over time 1981-2020 GR-it.svg 1,080 × 900; 11 KB
-
 Demographics age groups over time 1981-2020 JU-en.svg 1,080 × 900; 11 KB
-
 Demographics age groups over time 1981-2020 JU-it.svg 1,080 × 900; 11 KB
-
 Demographics age groups over time 1981-2020 LU-en.svg 1,080 × 900; 11 KB
-
 Demographics age groups over time 1981-2020 LU-it.svg 1,080 × 900; 11 KB
-
 Demographics age groups over time 1981-2020 NE-en.svg 1,080 × 900; 11 KB
-
 Demographics age groups over time 1981-2020 NE-it.svg 1,080 × 900; 11 KB
-
 Demographics age groups over time 1981-2020 NW-en.svg 1,080 × 900; 11 KB
-
 Demographics age groups over time 1981-2020 NW-it.svg 1,080 × 900; 11 KB
-
 Demographics age groups over time 1981-2020 OW-en.svg 1,080 × 900; 11 KB
-
 Demographics age groups over time 1981-2020 OW-it.svg 1,080 × 900; 11 KB
-
 Demographics age groups over time 1981-2020 SG-en.svg 1,080 × 900; 11 KB
-
 Demographics age groups over time 1981-2020 SG-it.svg 1,080 × 900; 11 KB
-
 Demographics age groups over time 1981-2020 SH-en.svg 1,080 × 900; 11 KB
-
 Demographics age groups over time 1981-2020 SH-it.svg 1,080 × 900; 11 KB
-
 Demographics age groups over time 1981-2020 SO-en.svg 1,080 × 900; 11 KB
-
 Demographics age groups over time 1981-2020 SO-it.svg 1,080 × 900; 11 KB
-
 Demographics age groups over time 1981-2020 SZ-en.svg 1,080 × 900; 11 KB
-
 Demographics age groups over time 1981-2020 SZ-it.svg 1,080 × 900; 11 KB
-
 Demographics age groups over time 1981-2020 TG-en.svg 1,080 × 900; 11 KB
-
 Demographics age groups over time 1981-2020 TG-it.svg 1,080 × 900; 11 KB
-
 Demographics age groups over time 1981-2020 TI-en.svg 1,080 × 900; 11 KB
-
 Demographics age groups over time 1981-2020 TI-it.svg 1,080 × 900; 11 KB
-
 Demographics age groups over time 1981-2020 UR-en.svg 1,080 × 900; 11 KB
-
 Demographics age groups over time 1981-2020 UR-it.svg 1,080 × 900; 11 KB
-
 Demographics age groups over time 1981-2020 VD-en.svg 1,080 × 900; 11 KB
-
 Demographics age groups over time 1981-2020 VD-it.svg 1,080 × 900; 11 KB
-
 Demographics age groups over time 1981-2020 VS-en.svg 1,080 × 900; 11 KB
-
 Demographics age groups over time 1981-2020 VS-it.svg 1,080 × 900; 11 KB
-
 Demographics age groups over time 1981-2020 ZG-en.svg 1,080 × 900; 11 KB
-
 Demographics age groups over time 1981-2020 ZG-it.svg 1,080 × 900; 11 KB
-
 Demographics age groups over time 1981-2020 ZH-en.svg 1,080 × 900; 11 KB
-
 Demographics age groups over time 1981-2020 ZH-it.svg 1,080 × 900; 11 KB
-
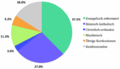
 Diagramme langues suisse.png 326 × 180; 5 KB
-
 Einwohnerentwicklung von Engelberg.svg 800 × 400; 29 KB
-
 Graphe demographie chf.png 1,526 × 997; 61 KB
-
 Historical population of Switzerland.svg 850 × 600; 48 KB
-
 Konfessionen Kanton Zürich.png 950 × 799; 123 KB
-
 Konfessionen St. Gallen.png 1,148 × 690; 194 KB
-
 Konfessionen Thurgau.png 1,095 × 752; 212 KB
-
 Migration suisse 2004-2007.png 1,181 × 1,033; 125 KB
-
 Migration étrangers en suisse 2004-2007.png 945 × 827; 97 KB
-
 Neue.vz.jpg 225 × 185; 11 KB
-
 Nouveau.recensement.jpg 251 × 188; 13 KB
-
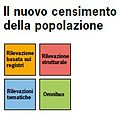 Nuovo.censimento.jpg 198 × 190; 14 KB
-
 Population density in Switzerland.png 870 × 530; 133 KB
-
 Population Development Switzerland.svg 1,350 × 810; 75 KB
-
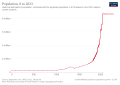
 Population growth in Switzerland, 2000-2021 (HY).png 1,130 × 469; 62 KB
-
 Religionen Kanton Waadt.png 1,187 × 754; 206 KB
-
 Religionszugehörigkeit Stadt Schaffhausen.png 1,254 × 670; 163 KB
-
 Religionszugehörigkeit Stadt St. Gallen.png 1,167 × 685; 169 KB
-
 Religionszugehörigkeit Stadt Winterthur.png 1,182 × 677; 161 KB
-
 RNI 1950 CH.svg 480 × 264; 7 KB
-
 Schweiz Ständige Wohnbevölkerung 1861 bis 2018.png 1,250 × 1,328; 70 KB
-
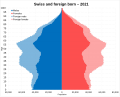 Swiss and foreign born population pyramid of Switzerland in 2021.svg 2,624 × 2,104; 49 KB
-
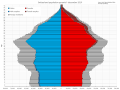
 Switzerland Animated Population Pyramid.gif 800 × 669; 2.1 MB
-
 Switzerland Demographics by Age 2007.PNG 913 × 624; 28 KB
-
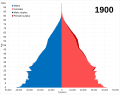 Switzerland population pyramid in 1900.svg 2,739 × 2,147; 43 KB
-
 Switzerland population pyramid in 2000.svg 2,739 × 2,147; 42 KB
-
 Switzerland population pyramid in 2100.svg 2,739 × 2,147; 43 KB
-
 Switzerland Population Pyramid.svg 639 × 478; 130 KB
-

-

-
 Wähleranteil Nationalrat Schweiz.svg 794 × 329; 42 KB
-
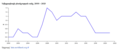
 Wähleranteil NR 1919-2007.gif 1,025 × 493; 42 KB
-
 Wähleranteil NR 1919-2007.png 1,025 × 493; 27 KB
-
 Wähleranteil.png 1,999 × 831; 121 KB


.png)


