Category:Demographics of Poland
Jump to navigation
Jump to search
Countries of Europe: Albania · Andorra · Armenia‡ · Austria · Azerbaijan‡ · Belarus · Belgium · Bosnia and Herzegovina · Bulgaria · Croatia · Cyprus‡ · Czech Republic · Denmark · Estonia · Finland · France‡ · Georgia‡ · Germany · Greece · Hungary · Iceland · Republic of Ireland · Italy · Kazakhstan‡ · Latvia · Liechtenstein · Lithuania · Luxembourg · Malta · Moldova · Monaco · Montenegro · Netherlands‡ · North Macedonia · Norway · Poland · Portugal‡ · Romania · Russia‡ · San Marino · Serbia · Slovakia · Slovenia · Spain‡ · Sweden · Switzerland · Turkey‡ · Ukraine · United Kingdom
Specific status: Faroe Islands · Gibraltar · Bailiwick of Guernsey · Isle of Man · Jersey – Limited recognition: Kosovo
‡: partly located in Europe
Specific status: Faroe Islands · Gibraltar · Bailiwick of Guernsey · Isle of Man · Jersey – Limited recognition: Kosovo
‡: partly located in Europe
demographics of the country | |||||
| Upload media | |||||
| Instance of |
| ||||
|---|---|---|---|---|---|
| Subclass of | |||||
| Location | Poland | ||||
| |||||
Subcategories
This category has the following 22 subcategories, out of 22 total.
Media in category "Demographics of Poland"
The following 31 files are in this category, out of 31 total.
-
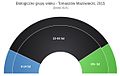 Bilogiczne grupy wieku, Tomaszów Mazowiecki, 2015.jpg 596 × 376; 61 KB
-
 BirthDeath 1950 PL.svg 480 × 320; 8 KB
-
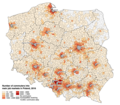 Commuters in Poland, 2016.png 3,248 × 2,834; 3.99 MB
-

-
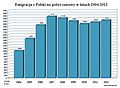 Emigracja na pobyt czasowy 2004-2012.jpg 927 × 676; 294 KB
-
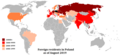 Foreignresidents.png 1,357 × 628; 59 KB
-
 Historical population of Poland.svg 850 × 600; 49 KB
-
 LICZBA URODZEŃ w POLSCE.pdf 1,239 × 1,754; 59 KB
-
 Mieszkańcy Gminy Oleśnica.png 937 × 607; 219 KB
-
 O status uchodzcy 2009.jpg 4,445 × 3,541; 531 KB
-
 Percentage of foreigners among all people insured in Polish social insurance, 2023.png 3,248 × 2,834; 1.88 MB
-
 Piramida wieku i płci Stare Babice 2018.png 787 × 1,235; 28 KB
-
 Piramida wieku mieszkańców Kożuchowa (2017).jpg 1,200 × 1,000; 110 KB
-
 Piramida wieku mieszkańców Kożuchowa (2020).svg 600 × 500; 22 KB
-
 Pochodzenie kresowe 2012.png 619 × 578; 79 KB
-
 Poland from 1950 to 2020 population pyramid.gif 1,200 × 896; 421 KB
-
 Poland Population Pyramid.svg 618 × 479; 54 KB
-
 Poziom wyksztalcenia mieszkancow Slupcy.jpg 768 × 419; 65 KB
-
 PRODUKCYJNE GRUPY WIEKU.png 1,515 × 802; 310 KB
-
 Przyznany status 2009.jpg 3,983 × 2,973; 424 KB
-
 RNI 1950 PL.svg 480 × 304; 7 KB
-
 Stopa bezrobocia powiat wolominski 2000-2010.png 628 × 379; 26 KB
-
 Struktura gospodarstw swiatniki gorne.jpg 1,837 × 1,046; 166 KB
-
 Struktura spoleczno zawodowa.jpg 1,847 × 1,362; 185 KB
-
 Struktura wieku i płci 97 Swiątniki Gorne.jpg 3,015 × 2,308; 589 KB
-
 Struktura Wykształcenia w swiatnikach gornych.jpg 1,847 × 1,611; 218 KB
-
 TFR in Poland, 2021.png 3,248 × 2,834; 1.74 MB
-
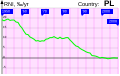
 Total fertility rate of Poland overtime to 2016.svg 850 × 600; 45 KB
-
 Wiszniów na przestrzeni lat.jpg 1,200 × 800; 52 KB
-
 Zgony - płeć-swiatniki gorne.jpg 1,871 × 1,612; 293 KB
-
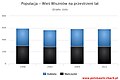
 Zmiany liczby ludności wsi na przestrzeni ostatnich lat.jpg 1,200 × 800; 56 KB


.jpg)
.svg)


