Category:Demographics of the United Kingdom
Sari la navigare
Sari la căutare
Țări în Europa: Albania · Andorra · Armenia‡ · Austria · Azerbaidjan‡ · Belgia · Belarus · Bosnia și Herțegovina · Bulgaria · Cehia · Cipru‡ · Croația · Danemarca · Elveția · Estonia · Finlanda · Franța‡ · Georgia‡ · Germania · Grecia · Irlanda · Islanda · Italia · Kazahstan‡ · Letonia · Liechtenstein · Lituania · Luxemburg · Macedonia de Nord · Malta · Republica Moldova · Monaco · Muntenegru · Norvegia · Țările de Jos‡ · Polonia · Portugalia‡ · Regatul Unit · România · Rusia‡ · San Marino · Serbia · Slovacia · Slovenia · Spania‡ · Suedia · Turcia‡ · Ucraina · Ungaria
Statute specifice: Insulele Feroe · Gibraltar · Guernsey · Jersey · Insula Man – Recunoaștere limitată: Kosovo
‡: partly located in Europe
Statute specifice: Insulele Feroe · Gibraltar · Guernsey · Jersey · Insula Man – Recunoaștere limitată: Kosovo
‡: partly located in Europe
demographics of country | |||||
| Încarcă multimedia | |||||
| Este un/o |
| ||||
|---|---|---|---|---|---|
| Subclasă a | |||||
| Locul actual | Regatul Unit | ||||
| |||||
Subcategorii
Această categorie conține următoarele 22 de subcategorii, dintr-un total de 22.
+
B
C
E
G
I
L
M
P
W
Fișiere media din categoria „Demographics of the United Kingdom”
Următoarele 200 fișiere se află în această categorie, dintr-un total de 408.
(pagina anterioară) (pagina următoare)-
 1871 Census.jpg 3.160x1.888; 443 KB
-
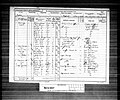 1891 Census.jpg 3.159x2.624; 509 KB
-
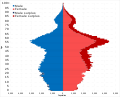
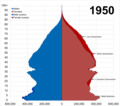 1950 United Kingdom population pyramid.png 2.662x2.356; 195 KB
-
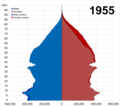 1955 United Kingdom population pyramid.png 2.646x2.341; 178 KB
-
 1960 United Kingdom population pyramid.png 2.646x2.341; 180 KB
-
 1965 United Kingdom population pyramid.png 2.646x2.341; 183 KB
-
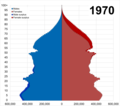 1970 United Kingdom population pyramid.png 2.646x2.341; 178 KB
-
 1975 United Kingdom population pyramid.png 2.646x2.341; 177 KB
-
 1980 United Kingdom population pyramid.png 2.646x2.341; 179 KB
-
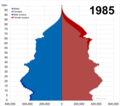 1985 United Kingdom population pyramid.png 2.646x2.341; 182 KB
-
 1990 United Kingdom population pyramid.png 2.646x2.341; 177 KB
-
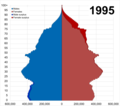 1995 United Kingdom population pyramid.png 2.646x2.341; 177 KB
-
 2000 United Kingdom population pyramid.png 2.646x2.341; 180 KB
-
 2001 White population in local authorities.svg 512x948; 766 KB
-
 2001-2011 White British.gif 777x1.200; 215 KB
-
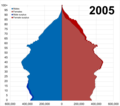 2005 United Kingdom population pyramid.png 2.646x2.341; 176 KB
-
 2010 United Kingdom population pyramid.png 2.646x2.341; 175 KB
-
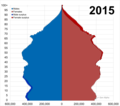 2015 United Kingdom population pyramid.png 2.646x2.341; 178 KB
-
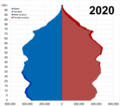 2020 United Kingdom population pyramid.png 2.646x2.341; 173 KB
-
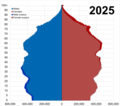 2025 United Kingdom population pyramid.png 2.646x2.341; 173 KB
-
 2030 United Kingdom population pyramid.png 2.646x2.341; 173 KB
-
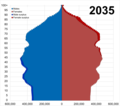 2035 United Kingdom population pyramid.png 2.646x2.341; 173 KB
-
 2040 United Kingdom population pyramid.png 2.646x2.341; 172 KB
-
 2045 United Kingdom population pyramid.png 2.646x2.341; 174 KB
-
 2050 United Kingdom population pyramid.png 2.646x2.341; 174 KB
-
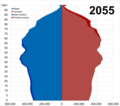 2055 United Kingdom population pyramid.png 2.646x2.341; 173 KB
-
 2060 United Kingdom population pyramid.png 2.646x2.341; 174 KB
-
 2065 United Kingdom population pyramid.png 2.646x2.341; 174 KB
-
 2070 United Kingdom population pyramid.png 2.646x2.341; 172 KB
-
 2075 United Kingdom population pyramid.png 2.646x2.341; 173 KB
-
 2080 United Kingdom population pyramid.png 2.646x2.341; 174 KB
-
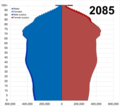 2085 United Kingdom population pyramid.png 2.646x2.341; 175 KB
-
 2090 United Kingdom population pyramid.png 2.646x2.341; 174 KB
-
 2095 United Kingdom population pyramid.png 2.646x2.341; 175 KB
-
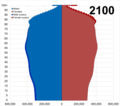 2100 United Kingdom population pyramid.png 2.646x2.341; 172 KB
-
 Aberdeen population pyramid 2020.svg 3.164x2.546; 31 KB
-
 Abortions in England and Wales.svg 2.544x1.920; 24 KB
-
 Abortions in the United Kingdom over time.svg 2.725x1.718; 28 KB
-
 Above the age of 65 years old across the UK.svg 512x948; 941 KB
-
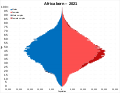 Africa born population pyramid in England and Wales in 2021.svg 2.624x2.042; 34 KB
-
-
 Age Structure of Drayton, Leicestershire.jpg 568x325; 39 KB
-
 Alcohol consumption by type of alcohol in the United Kingdom in 2016.svg 2.211x2.081; 6 KB
-
 Arabs in London population pyramid 2021.svg 2.775x2.280; 29 KB
-
 Asian Bangladeshi - 2011.svg 2.365x2.064; 32 KB
-
 Asian Bangladeshi in London population pyramid 2021.svg 2.775x2.280; 31 KB
-
 Asian Bangladeshi population pyramid 2021.svg 3.173x2.597; 33 KB
-
 Asian Chinese - 2011.svg 2.365x2.064; 32 KB
-
 Asian Chinese in London population pyramid 2021.svg 2.775x2.280; 31 KB
-
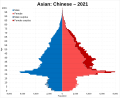 Asian Chinese population pyramid 2021.svg 3.189x2.586; 33 KB
-
 Asian Indian in London population pyramid 2021.svg 2.775x2.280; 33 KB
-
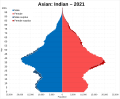 Asian Indian population pyramid 2021.svg 3.173x2.597; 34 KB
-
 Asian or Asian British Indian in 2011.svg 2.365x2.064; 33 KB
-
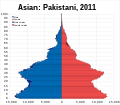 Asian Pakistani - 2011.svg 2.365x2.064; 32 KB
-
 Asian Pakistani in London population pyramid 2021.svg 2.775x2.280; 31 KB
-
 Asian Pakistani population pyramid 2021.svg 3.189x2.586; 32 KB
-
 Asian percentage UK wide in 2011.svg 512x948; 833 KB
-
 Asian population pyramid - UK 2011.svg 2.365x2.064; 31 KB
-
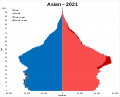 Asian population pyramid 2021.svg 3.189x2.586; 33 KB
-
 Asian total in London population pyramid 2021.svg 2.775x2.279; 33 KB
-
 Average household income in the UK from 1977 to 2021.svg 2.403x1.837; 12 KB
-
-
 Bedford population pyramid.svg 2.743x2.163; 29 KB
-
 Birmingham population pyramid.svg 2.742x2.163; 28 KB
-
 Births and deaths over time in England and Wales.svg 2.703x1.950; 16 KB
-
 Black African in London population pyramid 2021.svg 2.775x2.280; 31 KB
-
 Black African population pyramid 2021.svg 3.189x2.586; 33 KB
-
 Black Africans - 2011.svg 2.365x2.064; 32 KB
-
 Black Caribbean - 2011.svg 2.365x2.064; 32 KB
-
 Black Caribbean in London population pyramid 2021.svg 2.775x2.239; 33 KB
-
 Black Caribbean population pyramid 2021.svg 3.189x2.586; 33 KB
-
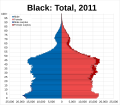 Black population pyramid - UK 2011.svg 2.365x2.064; 33 KB
-
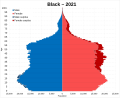 Black population pyramid 2021.svg 3.189x2.586; 34 KB
-
 Black total in London population pyramid 2021.svg 2.775x2.280; 32 KB
-
 Born to foreign born mothers in the UK 2021.svg 512x948; 875 KB
-
 Bradford population pyramid.svg 2.742x2.163; 29 KB
-
 Brighton and Hove industry over time.svg 2.200x1.569; 14 KB
-
 Brighton and Hove population pyramid.svg 2.743x2.163; 29 KB
-
 Bristol population pyramid.svg 2.743x2.168; 28 KB
-
 Bristol's industry sectors over time.svg 2.654x1.789; 15 KB
-
 British only identity population pyramid in England and Wales in 2021.svg 2.623x2.081; 33 KB
-
 Bsa-religion-question.svg 1.080x720; 69 KB
-
 Buddhist population pyramid in 2021 in England and Wales.svg 3.189x2.586; 32 KB
-
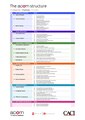 CACI's Acorn Structure (Uploaded June 2014).pdf 1.239x1.752; 403 KB
-
 Cambridge industry over time.svg 2.200x1.569; 14 KB
-
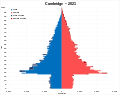 Cambridge population pyramid.svg 2.743x2.168; 28 KB
-

-
 Canterbury pop pyramid.svg 2.413x2.080; 29 KB
-
 Cardiff population pyramid.svg 2.743x2.168; 28 KB
-
 Cardiff's industry sectors over time.svg 2.654x1.789; 15 KB
-
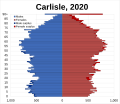 Carlisle pop pyramid.svg 2.413x2.080; 29 KB
-
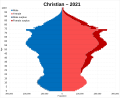 Christian population pyramid in 2021 in England and Wales.svg 3.189x2.586; 33 KB
-
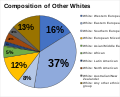 Composition of Other Whites in 2011.svg 2.198x1.785; 13 KB
-
 Conception rate per 1000 women in age group in England and Wales.svg 2.439x1.686; 19 KB
-
 Counties of the UK Gujarati.svg 512x948; 766 KB
-
 Counties of the UK Italian.svg 512x948; 747 KB
-
 Counties of the UK Mixed.svg 512x945; 840 KB
-
 Counties of the UK Other Asian.svg 512x948; 747 KB
-
 Counties of the UK Punjabi.svg 512x948; 747 KB
-
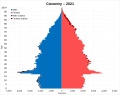 Coventry population pyramid.svg 2.743x2.168; 29 KB
-
 Crude birth and death rate over time in the UK.svg 2.186x1.657; 10 KB
-
 Crude birth rate and death rate over time in England and Wales.svg 3.058x2.230; 20 KB
-

-
 Deaths to drug misuse in England and Wales.svg 2.230x1.710; 30 KB
-
 Dependent children or none in families.svg 2.563x2.412; 6 KB
-
 Derby industry over time.svg 2.200x1.569; 14 KB
-
 Derby population pyramid.svg 2.743x2.163; 29 KB
-
 Disabled population pyramid in 2021 in England and Wales.svg 2.623x2.081; 33 KB
-
 Divorces in England and Wales from 1858 to 2020.svg 2.473x1.634; 59 KB
-
 Drive car to work population pyramid in England and Wales in 2021.svg 2.623x2.081; 29 KB
-
 Drug misuse crude death rate UK 2019.png 1.865x2.102; 388 KB
-
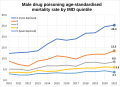
 Drug misuse death rate in England and Wales per gender.svg 2.354x1.688; 20 KB
-

-
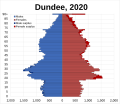 Dundee population pyramid 2020.svg 2.413x2.080; 30 KB
-
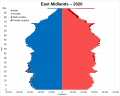 East Midlands population pyramid 2020.svg 3.189x2.541; 32 KB
-
 East of England population pyramid 2020.svg 3.164x2.546; 31 KB
-

-
 Edinburgh population pyramid 2020.svg 3.189x2.541; 31 KB
-
 Edinburgh's industry sectors over time.svg 2.654x1.789; 15 KB
-
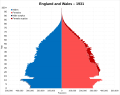
 England and Wales population pyramid in 1911.svg 2.742x2.163; 34 KB
-
 England and Wales population pyramid in 1921.svg 2.742x2.163; 34 KB
-
 England and Wales population pyramid in 1931.svg 2.743x2.163; 34 KB
-
 England Population pyramid estimate 2020.svg 3.189x2.541; 39 KB
-

-
-
 Ethnic demographics of England from 1981 - 2021.gif 1.200x1.097; 391 KB
-
 Ethnic demography of Leeds over time.gif 1.200x1.150; 459 KB
-
 Ethnic demography of Scotland from 1981 – 2011.gif 1.200x1.097; 313 KB
-
 Ethnic demography of the United Kingdom from 1951 - 2011.gif 1.200x1.097; 459 KB
-
 Ethnic makeup of England and Wales by single year age groups.svg 3.450x2.330; 50 KB
-
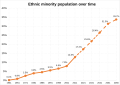 Ethnic minority population over time including projections to 2051.svg 2.564x1.816; 19 KB
-
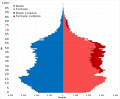
 Ethnic minority population pyramid 2021.svg 3.189x2.586; 33 KB
-
 Ethnic minority total population pyramid UK.svg 2.365x2.064; 33 KB
-
 Ethnicity of school pupils in Great Britain over time.gif 1.200x1.097; 414 KB
-
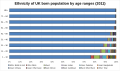 Ethnicity of UK born population in 2011 by age ranges.svg 3.355x1.968; 24 KB
-
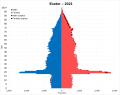 Exeter pop pyramid.svg 2.743x2.163; 28 KB
-
 Falkland-Islands-demography.svg 1.080x720; 30 KB
-
 Families by dependent children or none.svg 2.553x2.440; 6 KB
-
 Families with dependent children by type.svg 2.552x2.440; 6 KB
-

-
 Fertility rate of each country of birth group in the UK, 1971-2001.svg 2.376x1.730; 12 KB
-
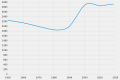
 Fertilty rate of the United Kingdom from 1541 to 2019.svg 850x600; 71 KB
-
 Figure-1.png 600x387; 25 KB
-
 Foreign born and UK born from 1981 to 2021 by age groupings.gif 1.200x802; 440 KB
-
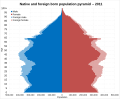 Foreign born and UK born in 2011 population pyramid.svg 2.558x2.107; 40 KB
-
-
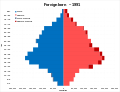
 Foreign born in 2011 population pyramid.svg 2.365x2.064; 31 KB
-
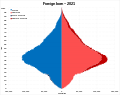 Foreign born in England and Wales population pyramid 2021.svg 2.623x2.081; 42 KB
-

-
 Foreign born population in the UK in 2021.svg 512x948; 939 KB
-
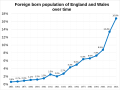 Foreign born population over time in percentage in England and Wales.svg 2.338x1.747; 20 KB
-
 Foreign born population pyramid in 1971 in Great Britain.svg 2.810x2.165; 15 KB
-
 Foreign born population pyramid in 1981 in Great Britain.svg 2.810x2.165; 17 KB
-
 Foreign born population pyramid in 1991 in England and Wales.svg 2.810x2.162; 18 KB
-
 Foreign born population pyramid in 2001 in England and Wales.svg 2.810x2.162; 17 KB
-
 Foreign born population pyramid in 2011 in England and Wales.svg 2.810x2.162; 17 KB
-

-

-
 Glasgow population pyramid 2020.svg 3.164x2.546; 31 KB
-
 Glasgow's industry sectors over time.svg 2.654x1.789; 15 KB
-
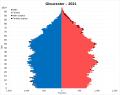 Gloucester pop pyramid.svg 2.743x2.163; 28 KB
-
 Greater Manchester population pyramid 2020.svg 3.164x2.546; 30 KB
-
 Greater Manchester's industry over time.svg 2.654x1.789; 15 KB
-

-
 Gypsy Irish Traveller population pyramid 2011 UK.svg 2.365x2.064; 31 KB
-
 Hindu population pyramid in 2021 in England and Wales.svg 3.189x2.586; 33 KB
-
 Home ownership for families by age group from 1961 to 2017 in the UK.svg 2.624x1.897; 22 KB
-
 Household by size in the UK.svg 2.535x2.503; 9 KB
-
 Hull industry over time.svg 2.200x1.569; 14 KB
-
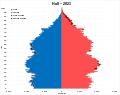 Hull population pyramid.svg 2.743x2.163; 28 KB
-
 Individual Disposable Income (excl. NI).png 1.315x1.218; 556 KB
-
 Industry of Coventry over time.svg 2.654x1.789; 15 KB
-
 Industry of Oxford over time.svg 2.200x1.569; 14 KB
-
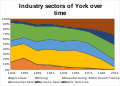 Industry of York over time.svg 2.200x1.569; 14 KB
-
 Intentions of cigarette smokers on quitting over time in Great Britain.gif 1.200x1.035; 237 KB
-
 Irish born population over time in England and Wales.svg 2.338x1.676; 15 KB
-
 Isle of Wight population pyramid.svg 2.743x2.163; 28 KB
-
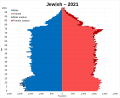 Jewish population pyramid in 2021 in England and Wales.svg 3.189x2.586; 34 KB
-
 Lancaster pop pyramid.svg 2.413x2.080; 29 KB
-
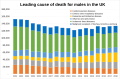 Leading causes of death for males within the United Kingdom.svg 2.660x1.741; 20 KB
-
 Leading causes of deaths for females within the United Kingdom.svg 2.660x1.741; 21 KB
-
 Leeds industry sectors over time.svg 2.332x1.588; 15 KB
-
 Leeds population pyramid.svg 2.743x2.168; 29 KB
-
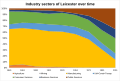 Leicester industry sectors over time.svg 2.654x1.786; 15 KB
-
 Leicester population pyramid.svg 2.742x2.163; 29 KB
-
 LGB+ population group population pyramid 2021.svg 2.475x2.172; 15 KB
-
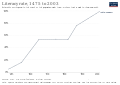 Literacy rates within the United Kingdom overtime.svg 850x600; 25 KB
-
 Live births per 1000 women by age group of women in England and Wales.svg 2.203x1.656; 20 KB
-
 Liverpool population pyramid.svg 2.743x2.168; 29 KB
-
 Liverpool's industry sectors over time.svg 2.654x1.789; 15 KB
-
 London population pyramid.svg 2.742x2.163; 34 KB
-
 Lone parent families with dependent children in each region.svg 512x729; 264 KB
-
 Luton population pyramid.svg 2.742x2.163; 28 KB
-
 Luton's industry sectors over time.svg 2.654x1.812; 23 KB
-
-
 Manchester population pyramid.svg 2.743x2.168; 28 KB
-
 Manchester's industry sectors over time.svg 2.654x1.789; 15 KB
-
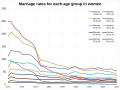
 Marriage rates in age groups for men in England and Wales.svg 2.808x2.084; 24 KB
-
 Marriage rates in age groups for women in England and Wales.svg 2.808x2.084; 23 KB
-
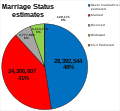 Marriage Status of England and Wales 2020.svg 2.305x2.133; 9 KB


_across_the_UK_mapped_in_2020.svg)


.png)


