Category:Diagrams by Jane S. Richardson
Jump to navigation
Jump to search
Diagrams by Jane S. Richardson
Media in category "Diagrams by Jane S. Richardson"
The following 168 files are in this category, out of 168 total.
-
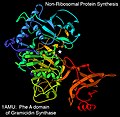 1amu gramicidin synthase PheA rib.jpg 820 × 800; 294 KB
-
 1axc PCNA ProCheck Rama.jpg 500 × 500; 158 KB
-
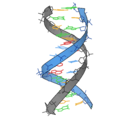 1bna naba ribbon v.png 3,228 × 3,180; 513 KB
-
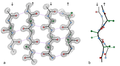
 1cag collagen triple helix.tiff 1,200 × 740; 109 KB
-
 1gwe antipar betaSheet both.png 2,000 × 1,100; 1.04 MB
-
 1n0j H mit MnSOD D1 rib.png 807 × 757; 52 KB
-
 1n0j H mit MnSOD D2 rib.png 806 × 757; 53 KB
-
 1n11 ankyrin repeats curl.tiff 1,200 × 800; 189 KB
-
 1QRE L3betaHelix.jpg 949 × 768; 169 KB
-
 1qys TOP7 design rib.png 1,200 × 1,000; 456 KB
-
 1rns supr on 7rsa.jpg 1,333 × 1,234; 443 KB
-
 1sdy CuZnSOD dimer ribbon.png 800 × 770; 58 KB
-
 1xk8 trimer ribbon.png 1,170 × 1,024; 253 KB
-
 27 Lys rotamers.png 2,556 × 2,276; 254 KB
-
 2brd bacteriorhodopsin biolU rib top.tiff 1,200 × 1,200; 415 KB
-
 2c9v CuZn rib n site.png 700 × 651; 69 KB
-
 2k5d NMR ensemble ribbons.jpg 973 × 725; 394 KB
-
 2nn6 exosome rib.png 2,700 × 2,700; 1.86 MB
-
 2nr2 ubq 144models.png 2,700 × 2,700; 840 KB
-
 2RH1 trim rib lig.png 4,000 × 3,650; 1 MB
-
 2SOD ribbon colorPencil WhBkgd.png 3,000 × 3,200; 4.58 MB
-
 2SOD ribbon pastel.jpg 1,200 × 1,200; 1.41 MB
-
 2zta GCN4 Leu zip core.tif 1,200 × 900; 306 KB
-
 3hla ribbon.png 1,000 × 1,300; 98 KB
-
 3kin kinesin ribbon.png 2,700 × 2,700; 704 KB
-
 3sn6 G-coupled ribbon.png 3,090 × 3,820; 1.49 MB
-
 3u5z clamp closed.png 600 × 600; 346 KB
-
 3u5z clamp open.png 600 × 600; 351 KB
-
 4fby spline het.png 2,640 × 1,840; 1.38 MB
-
 4fc1 Arg17 neutron H vs D in map.png 2,388 × 1,793; 1.43 MB
-
 4sbv ribbon 3mer.png 2,700 × 2,700; 922 KB
-
 50S Hmar 3CC2 ribosome outline.jpg 10,000 × 9,400; 933 KB
-
 50S Hmar 3CC2 ribosome outline.png 2,500 × 2,350; 118 KB
-
 5fold 2dom 3CDX ribbon.png 900 × 900; 372 KB
-
 6 Ramachandran plots of wwPDB validation.png 13,400 × 9,040; 10.04 MB
-
 70S Ecoli Ribosome outline.jpg 10,000 × 12,000; 1.15 MB
-
 70S Ecoli Ribosome outline.png 2,500 × 3,000; 162 KB
-
 All-atom contacts for two GC basepairs of RNA.jpg 1,031 × 689; 241 KB
-
 All-atomContacts 1gciAlas.jpg 518 × 720; 131 KB
-
 Alpha vs 310 helix end views.jpg 1,340 × 720; 178 KB
-
 AlphaHemolysin membrane heptamer 7AHL sideVw.jpg 800 × 768; 482 KB
-
 AlphaHemolysin membrane heptamer 7AHL VwDownPore.jpg 1,600 × 1,602; 1.06 MB
-
 Bbellin design blueRibbon.png 2,454 × 3,297; 1.83 MB
-
 BPTI rib shaded SSylw.jpg 5,900 × 4,000; 4.68 MB
-
 BPTI ribbon 1bpi.jpg 500 × 720; 131 KB
-
 BPTI ribbon bw.jpg 1,883 × 1,366; 441 KB
-
 BPTI ribbon.jpg 512 × 768; 145 KB
-
 BPTI seq ribbon sticks.jpg 1,024 × 768; 246 KB
-
 BPTI swish ribbon.jpg 516 × 765; 153 KB
-
 CAP-DNA 1cgp rib.tiff 1,200 × 1,160; 343 KB
-
 CAPdimer.jpg 730 × 768; 552 KB
-
 CAPgreekKeyPair.jpg 1,024 × 768; 112 KB
-
 Carboxypeptidase-A rib bw.tif 1,200 × 940; 299 KB
-
 CASP PredCtr cumCalpha plot T0398.jpg 1,000 × 700; 600 KB
-
 Clamp loader open 3u5z.tiff 1,000 × 1,000; 629 KB
-
 Classic beta-bulge schematic.png 660 × 860; 163 KB
-
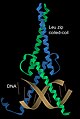 Coiled-coil TF Max on DNA.jpg 900 × 1,340; 252 KB
-
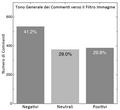 Comment tone vertBarChart it.png 653 × 600; 32 KB
-
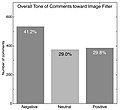 Comment tone vertBarChart.jpg 653 × 600; 72 KB
-
 Comment tone vertBarChart.png 653 × 600; 54 KB
-
 Crambin P41 hi-res map 3nir.tiff 1,024 × 768; 695 KB
-
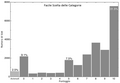
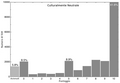 Culturally-neutral votes vertBarChart it.png 967 × 670; 45 KB
-
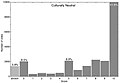 Culturally-neutral votes vertBarChart.jpg 967 × 670; 87 KB
-
 Culturally-neutral votes vertBarChart.png 967 × 670; 62 KB
-
 CuZn SOD precession photo C2.jpg 550 × 550; 215 KB
-
 CuZnSOD 2dimers.jpg 700 × 768; 221 KB
-
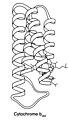 Cytochrome b562 ribbon BW.jpg 1,610 × 2,800; 747 KB
-
 Cytochrome C 1cyt Fe rib.tif 1,200 × 800; 333 KB
-
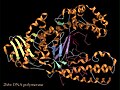 DNApolymerase-DNA complex 2HHV ribbon.jpg 1,024 × 768; 362 KB
-
 Early computer ribbon TrpRepressor intertwinedDimer 1WRP.jpg 1,024 × 768; 342 KB
-
 Easy-choice votes vertBarChart it.png 967 × 670; 43 KB
-
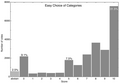
 Easy-choice votes vertBarChart.jpg 967 × 670; 90 KB
-
 Easy-choice votes vertBarChart.png 967 × 670; 63 KB
-
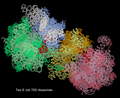 Ecoli 70S ribosome pair with tRNA mRNA.png 2,700 × 2,200; 2.14 MB
-
 Elastase ribbon BW.jpg 4,000 × 3,458; 2.66 MB
-
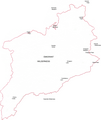 Emigrant Wilderness outline map.png 1,910 × 2,270; 455 KB
-
 F22 calmodulin 3cln-2bbm both.tiff 1,200 × 1,100; 120 KB
-
 F42 K+channel select stereo.jpg 2,000 × 1,019; 597 KB
-
 F44 HolJnct 2crx.jpg 2,700 × 2,700; 1.45 MB
-
 Felix design model redRibbon.png 3,200 × 3,720; 6.21 MB
-
 Flavodoxin worm drawing.jpg 2,391 × 2,344; 544 KB
-
 G riboswitch RNA ribbon.jpg 760 × 760; 163 KB
-
 G riboswitch site w map contacts suite-labels.jpg 1,024 × 768; 540 KB
-
 General-case Ramachandran data and contours T8000.png 2,320 × 2,470; 1.42 MB
-
 GFP 1ema ribbon fluor.png 2,000 × 2,600; 534 KB
-
 Glycine Ramachandran data and contours T8000.png 2,320 × 2,470; 1.21 MB
-
 GNRA tetraloop motifs.jpg 1,024 × 768; 262 KB
-
 Group-I intron secstr 1grz.tiff 1,200 × 1,060; 181 KB
-
 Half-vault 39-fold.png 4,520 × 3,608; 3.9 MB
-
 Half-vault front.png 4,520 × 3,608; 3.73 MB
-
 Hand-drawn helix ribbons at various angles.jpg 1,024 × 768; 230 KB
-
 Helical Wheel 2NRL 77-92 KaelFischer.jpg 500 × 500; 111 KB
-
 Hemoglobin beta red whBkg.tif 600 × 600; 341 KB
-
 Hemoglobin betaSubunit ribbon.jpg 600 × 768; 270 KB
-
 HEW lysozyme rib bw.tif 1,200 × 840; 240 KB
-
 Immunoglobulin VL dom ribbon bw.jpg 1,670 × 2,340; 699 KB
-
 Importance votes vertBarChart it.png 967 × 670; 47 KB
-
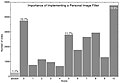 Importance votes vertBarChart.jpg 967 × 670; 101 KB
-
 Importance votes vertBarChart.png 967 × 670; 71 KB
-
 Incredulase framed.jpg 672 × 840; 561 KB
-
 Insulin worm bw.jpg 1,200 × 833; 114 KB
-
 KiNG backrubFit modeling in density.jpg 3,200 × 2,332; 2.47 MB
-
 KiNGinMolProbity validation3Dgraphics.jpg 2,062 × 1,636; 761 KB
-
 LDH dom1 ribbon edge view bw.jpg 2,160 × 2,800; 901 KB
-
 LDH dom1 ribbon side view.jpg 3,000 × 3,906; 1.32 MB
-
 Logged-out votes vertBarChart it.png 967 × 670; 44 KB
-
 Logged-out votes vertBarChart.jpg 967 × 670; 89 KB
-
 Logged-out votes vertBarChart.png 967 × 670; 62 KB
-
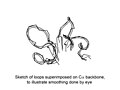 Loop smoothing for ribbons.jpg 1,024 × 768; 152 KB
-
 MolProbity clashscore vs year.png 986 × 756; 118 KB
-
 Myoglobin helix cylinder sketch.jpg 1,200 × 1,200; 341 KB
-
 Myohemerythrin rib BW.jpg 1,880 × 2,800; 742 KB
-
 Nucleosome 1aoi rib.tiff 1,200 × 1,060; 400 KB
-
 Offset lines illusion for beta ribbons.jpg 1,024 × 768; 191 KB
-
 Pectate lyase R3betaHelix.jpg 1,024 × 768; 211 KB
-
 PHBH domains.jpg 1,024 × 768; 733 KB
-
 PhiPsi drawing with plane and labels.jpg 720 × 768; 135 KB
-
 Phosphorylase domain2.jpg 1,024 × 768; 307 KB
-
 Potato CPA inhibitor ribbon.jpg 1,200 × 900; 405 KB
-
 Protein backbone PhiPsiOmega drawing.jpg 548 × 1,000; 55 KB
-
 Protein backbone PhiPsiOmega drawing.svg 520 × 988; 77 KB
-
 Protein Hydrogens in electron Density 1yk4 Y13.jpg 1,024 × 768; 287 KB
-
 Rama redux Gly 3600x3600 graOrng.jpg 3,600 × 3,600; 4.18 MB
-
 Ramachandran plot general 100K.jpg 750 × 670; 225 KB
-
 Ramachandran plot Gly.jpg 750 × 670; 258 KB
-
 Ramachandran plot original outlines.jpg 500 × 500; 67 KB
-
 Ramachandran plot Pro.jpg 750 × 670; 120 KB
-
 RDC curves on NMRmodels 1d3z D58NH.jpg 1,024 × 768; 141 KB
-
 Reversible-hiding votes vertBarChart it.png 967 × 670; 58 KB
-
 Reversible-hiding votes vertBarChart.jpg 967 × 670; 91 KB
-
 Reversible-hiding votes vertBarChart.png 967 × 670; 74 KB
-
 Ribbon-drawing technique two examples.jpg 800 × 1,430; 307 KB
-
 RibonucleaseA ribbon 7rsa.jpg 880 × 800; 193 KB
-
 RibonucleaseA SS line.png 920 × 780; 159 KB
-
 RibonucleaseA SS paleRib.png 920 × 780; 158 KB
-
 Ribosome Ecoli70S QuteMol.tiff 1,200 × 1,200; 1.47 MB
-
 RNA backbone rebuild 3cc2 5S 77.png 900 × 500; 115 KB
-
 RNA residue-Suite diagram.tif 920 × 780; 793 KB
-
 RNA residueSuite diagram.tif 920 × 780; 704 KB
-
 Rubredoxin Fe 2rxn rib.tif 900 × 800; 214 KB
-
 Smotif in RNA suite-labeled.jpg 1,024 × 768; 245 KB
-
 Staph nuclease brass Arg-Phe on glass map stack.png 556 × 740; 776 KB
-
 Staph nuclease brass model to UV worm.png 1,050 × 1,152; 1.44 MB
-
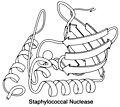
 Staph nuclease JSR BW shaded-ribbon.jpg 1,024 × 768; 157 KB
-
 Staph nuclease ribbon bw.jpg 2,200 × 1,970; 739 KB
-
 Structure validation concept.jpg 2,200 × 2,200; 1.28 MB
-
 Subtilisin rib bw.tif 1,200 × 900; 330 KB
-
 Superoxide dismutase Cu Zn site.jpg 1,024 × 768; 154 KB
-
 Swall Meadows from Open Street Map.png 1,345 × 1,116; 424 KB
-
 Target3dsmRib 354predictedModels CASP8.jpg 1,200 × 1,006; 647 KB
-
 TIM ribbon pastel wide mat.jpg 3,090 × 2,490; 3.49 MB
-
 Trans Proline Ramachandran data and contours T8000.png 2,320 × 2,470; 402 KB
-
 Transcription factor Zif268 binding DNA.jpg 900 × 750; 218 KB
-
 Triosephosphate Isomerase Ribbon pastel.png 2,650 × 2,010; 5.69 MB
-
 TriosePhosphateIsomerase endVw ribbon BWline.jpg 660 × 768; 169 KB
-
 TriosePhosphateIsomerase Ribbon pastel photo mat edit.jpg 2,547 × 1,952; 2.46 MB
-
 TriosePhosphateIsomerase Ribbon pastel trans.png 1,600 × 1,200; 1.64 MB
-
 TriosePhosphateIsomerase Ribbon pastel whitebkg.jpg 1,600 × 1,200; 1.04 MB
-
 TriosePhosphateIsomerase Ribbon pastel.jpg 1,024 × 748; 272 KB
-
 TriosePhosphateIsomerase Ribbon pastel.png 1,600 × 1,200; 3.02 MB
-
 TriosephosphateIsomerase Ribbon pastel.png 1,600 × 1,200; 3.03 MB
-
 TRNA 1ehz coil lots.jpg 600 × 489; 161 KB
-
 Twort groupI intron RNAribbon stereo.jpg 1,024 × 768; 396 KB
-
 User-flag votes vertBarChart it.png 967 × 670; 47 KB
-
 User-flag votes vertBarChart.jpg 967 × 670; 93 KB
-
 User-flag votes vertBarChart.png 967 × 670; 64 KB
-
 Validation outlier legend.jpg 1,024 × 768; 208 KB
-
 Wenxiang diagram.jpg 410 × 392; 115 KB


