Category:Diagrams of Maya period
Jump to navigation
Jump to search
Media in category "Diagrams of Maya period"
The following 26 files are in this category, out of 26 total.
-
Changes of temperature of world 1 600 ad 01 01.png 1,445 × 607; 140 KB
-
Changes of temperature of world 1000 1500 ad 01 01.png 1,504 × 689; 176 KB
-
Changes of temperature of world 500 1000 ad 01 01.png 1,511 × 715; 159 KB
-
Changes of temperature of world 500 1500 ad 01 01.png 1,390 × 733; 159 KB
-
Changes of temperature of world 700 1000 ad 01 01.png 1,460 × 809; 171 KB
-
Chichen itza pdsi 900 2000 1.svg 1,440 × 720; 95 KB
-
Chichen itza pdsi 950 1550 1.svg 1,440 × 720; 69 KB
-
Chichen itza summer precipitation index spi 900-1500 ad 1.svg 1,800 × 720; 74 KB
-
Delta t against 200 years moving northern hemisphere 100 1600 ad 1.svg 1,487 × 646; 82 KB
-
Juxtlahuaca cave delta o18z data 1.svg 1,430 × 466; 56 KB
-
Juxtlahuaca cave summer precipitation 1.svg 1,437 × 577; 62 KB
-
Lake chichancanab sediment density 1.svg 1,389 × 501; 34 KB
-
Lake martin delta c13 0 1500 ad 1.svg 1,377 × 563; 39 KB
-
Lake Martin delta o18 0 1500 ad 1.svg 1,387 × 494; 49 KB
-
Lake martin lithics percent 0 1700 ad 1.svg 1,389 × 485; 16 KB
-
Macal chasm reflectance 0 1600 ad 1.svg 1,458 × 588; 199 KB
-
Macal chasm reflectance 0 1990 ad 1.svg 1,439 × 551; 136 KB
-
Macal chasm reflectance 600 1200 ad 1.svg 1,453 × 586; 144 KB
-
Macal chasm uvl 500 1600 ad 1.svg 1,471 × 590; 88 KB
-
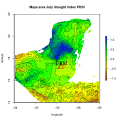
Maya area drought index pdsi yearv 1418 1.svg 473 × 576; 1.3 MB
-
Maya area july 2004 precipitation 1.svg 630 × 630; 624 KB
-
Maya area july aridity index 2.svg 473 × 576; 4.29 MB
-
Maya area july precipitation difference 2004 1980 1.svg 496 × 576; 3.86 MB
-
Maya area pdsi july 1980-2020 1.svg 630 × 630; 511 KB
-
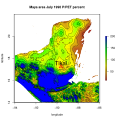
Maya area ptopet july 1990 1.svg 630 × 630; 1.3 MB
-
Yamal peninsula summer jj temperature 700 1100 ad 1.svg 1,437 × 567; 48 KB


