Category:Economic charts of Iran
Jump to navigation
Jump to search
Media in category "Economic charts of Iran"
The following 72 files are in this category, out of 72 total.
-
 (2015) کل مصرف انرژی اولیه ایران، توسط سوخت.svg 898 × 431; 331 KB
-
 Balance of Trade - Iran.svg 667 × 290; 27 KB
-
 Debt service-Iran.png 740 × 350; 13 KB
-
 En explore tree map hs import irn all show 2012.png 600 × 506; 35 KB
-
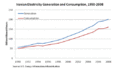
 Energy consumption per capita-Iran (Cro).PNG 740 × 350; 10 KB
-
 Energy consumption per capita-Iran.png 740 × 350; 13 KB
-
 FDI Iran (Cro).PNG 670 × 350; 9 KB
-
 FDI Stock- Iran.png 863 × 437; 31 KB
-
 FDI-Iran.png 572 × 364; 23 KB
-
 FLOW CHART (IRAN BUDGET).png 934 × 839; 19 KB
-

-
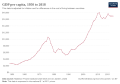 GDP per capita development in Iran 1950-2018.svg 850 × 590; 23 KB
-
 GDP per capita development in Iran.svg 850 × 600; 32 KB
-
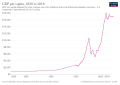 GDP per capita development of Iran.svg 850 × 600; 32 KB
-
 Gini coefficient in Iran (1386 to 1392 SH).svg 720 × 540; 33 KB
-
 GPD per capita development of Iran.jpg 1,053 × 654; 49 KB
-
 Ilam Agri Prods 2018.png 835 × 401; 64 KB
-
 Import tree map - Iran.svg 667 × 290; 398 KB
-
 Index of economic complexity - Iran.svg 714 × 323; 886 KB
-
 Industrial Workforce Middle East (Cro).PNG 660 × 800; 40 KB
-
 Inflation Iran CPI.jpg 1,500 × 1,125; 234 KB
-
 Inflation rate in Iran (1315-1392).svg 720 × 540; 61 KB
-
 Inflation rate in Iran (1325-1396).svg 576 × 432; 50 KB
-
 Inflation-Iran.png 740 × 350; 15 KB
-
 IR Telecom (Cro).JPG 800 × 600; 62 KB
-
 IR Telecom.JPG 1,500 × 1,125; 169 KB
-
 Iran BDP (Cro).jpg 2,048 × 1,536; 645 KB
-
 Iran Budget Process.png 875 × 507; 58 KB
-
 IRAN CPI broad money FXreserves.jpg 1,500 × 1,125; 253 KB
-
 Iran Electricity (Cro).PNG 480 × 360; 10 KB
-
 Iran Export Treemap 2010.svg 512 × 512; 280 KB
-
 Iran Export Treemap.jpg 2,668 × 2,085; 888 KB
-
 IRAN Foreign Trade.png 472 × 422; 30 KB
-
 IRAN GDP.jpg 2,048 × 1,536; 381 KB
-
 Iran household income per decile.png 920 × 699; 124 KB
-
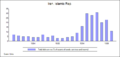
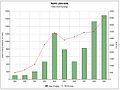
 Iran market liquidity.png 248 × 297; 5 KB
-
 Iran Merchantile Exchange.png 751 × 641; 32 KB
-
 IRAN oil&gas production (Cro).JPG 800 × 600; 111 KB
-
 IRAN oil&gas production.jpg 1,500 × 1,125; 320 KB
-
 Iran population&gdp.JPG 743 × 495; 78 KB
-
 Iran subsidies reform plan2.png 419 × 273; 27 KB
-
 Iran unemployement min-wage Per-capita-income-growth.jpg 1,500 × 1,125; 199 KB
-
 Iran unemployment 1384 1392 SH.svg 720 × 540; 52 KB
-
 Iran's economic growth from 1371 to 1391(SH).svg 667 × 385; 41 KB
-
 Iran's GDP contribution by province.png 1,192 × 1,596; 90 KB
-
 Iran's Total Primary Energy Consumption in 2015.svg 898 × 431; 274 KB
-
 Iran's Total Primary Energy Consumption in 2016.svg 899 × 429; 722 KB
-
 Iran-Budget.JPG 2,048 × 1,535; 213 KB
-
 Iran-electricity.gif 520 × 301; 26 KB
-
 IRAN-GDP-real-growth.jpg 1,500 × 1,125; 99 KB
-
 IRANbalanceofpayment.jpg 1,500 × 1,125; 162 KB
-
 Iraneco.PNG 1,998 × 1,498; 1.03 MB
-
 Iranoilandgas.jpg 1,500 × 1,125; 182 KB
-
 IranprovincesGDP.jpg 732 × 593; 123 KB
-
 Irecosector ja.png 469 × 416; 94 KB
-
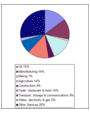 Irecosector.gif 2,976 × 3,968; 470 KB
-
 Islamic Republic of Iran Exports Treemap 2017.svg 900 × 900; 402 KB
-
 Provinces of Iran GDP 2004 (Cro).jpg 2,048 × 1,536; 509 KB
-
 Socio-eco expenditures IRAN.jpg 1,500 × 1,125; 117 KB
-
 Tedpix.jpg 1,500 × 1,125; 222 KB
-
 Tehran Stock Exchange.png 1,337 × 829; 362 KB
-
 TEPIX (Cro).PNG 800 × 600; 125 KB
-
 Tepix.jpg 960 × 540; 53 KB
-
 TEPIX.PNG 2,048 × 1,536; 566 KB
-
 TEPIXvsDJIA.png 1,500 × 1,125; 1.3 MB
-
 Total Energy Consumption in iran-EN-2007.png 963 × 644; 55 KB
-
 Total Energy Consumption in iran-FA-2007.png 934 × 625; 57 KB
-
 Trade balance Iran.png 740 × 350; 14 KB
-
 US dollar Iranian rial exchange rates (Cro).jpg 2,048 × 1,536; 253 KB
-
 USD-IRR exchange rate.JPG 1,050 × 707; 125 KB
-
 ساختار دادهای کد ملی کالا.png 1,200 × 469; 405 KB
-
 گروه های کارفرمایی.jpg 3,000 × 2,250; 484 KB
_%DA%A9%D9%84_%D9%85%D8%B5%D8%B1%D9%81_%D8%A7%D9%86%D8%B1%DA%98%DB%8C_%D8%A7%D9%88%D9%84%DB%8C%D9%87_%D8%A7%DB%8C%D8%B1%D8%A7%D9%86%D8%8C_%D8%AA%D9%88%D8%B3%D8%B7_%D8%B3%D9%88%D8%AE%D8%AA.svg)


.PNG)

.PNG)


.png)
_in_countries_of_the_region_during_the_COVID-19_pandemic_(HY).jpg)


.svg)


.PNG)

.svg)
.svg)

.JPG)

.jpg)


.PNG)


.JPG)


.svg)


.jpg)


.PNG)


.jpg)

