Category:Economics
Irez a navigado
Irez a serchilo

| Category Economics on sister projects: | |||||||||
|---|---|---|---|---|---|---|---|---|---|
Wiktionary |
Wikibooks |
Wikiversity |
Wikinews |
Wikisource |
Wikiquote | ||||
English: Economics
Italiano: Economia
日本語: 経済学
Українська: Економіка
scienco pri produktado kaj mendado de varoj kaj servoj  | |||||
| Sendez 'media' | |||||
| Prononco-registraĵo | |||||
|---|---|---|---|---|---|
| Esas |
| ||||
| Subklaso di | |||||
| Parto di |
| ||||
| Havas parton |
| ||||
| Diferanta de | |||||
| |||||
Subkategorii
Ica kategorio havas la sequanta 35 subkategorii, ek 35.
"Media" en kategorio "Economics"
La sequanta 200 arkivi es en ica kategorio, ek 248.
(Antea pagino) (sequanta pagino)-
De-Wirtschaftswissenschaft.ogg 2,6 s; 25 KB
-
 0 ARPA 2021 Infographic.png 1 767 × 860; 875 KB
-
 0 Pie charts - Jobs and Recession timing.png 1 167 × 668; 76 KB
-
 16-Skript Lektion XVI 3.0.pdf 1 239 × 1 754, 42 pagini; 3,62 MB
-
 2022 Dow Jones Industrial Average and S&P 500.png 1 318 × 466; 77 KB
-
 3Step.png 414 × 532; 31 KB
-
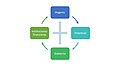
 4-pillars-of-knowledge-economy.webp 1 018 × 491; 14 KB
-
 Actores sociales frente al desafio de la sustentabilidad - Final OK.pdf 943 × 1 387, 256 pagini; 9,4 MB
-
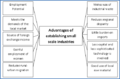 Advantages of estabishing small scale industries.png 546 × 358; 6 KB
-
 Agregats monetaires.png 888 × 434; 40 KB
-
 AIOS GmbH Wirtschaftsprüfungsgesellschaft Steuerberatungsgesellschaft.jpg 3 401 × 1 817; 283 KB
-
Andrew Yang- New Economic Measurements of Human Well-Being.webm 8 min 58 s, 1 920 × 1 080; 176,97 MB
-
 Anlagevermögen nach Sektoren.pdf 1 752 × 1 239; 32 KB
-
 Artbridge Kunstvermietung warum Unternehmen Kuns tmieten.jpg 2 690 × 2 017; 544 KB
-
 Artbridge Kunstvermietung Warum Unternehmen Kunst von bekannten Künstlern bevorzugen.jpg 2 706 × 2 016; 622 KB
-
 Artbridge Kunstvermietung, was Kuns tim Unternehmen schafft.jpg 2 698 × 2 025; 517 KB
-
 Asset-Prices-Simulated-using-the-Brownian-Motion-Stochastic-Process-Many.png 2 307 × 1 273; 1,63 MB
-
 Autoausstellumg 1907.jpg 1 654 × 2 336; 261 KB
-
 Bolzano, Italy - via Macello - Moneta fiscale - Fiscal Money.jpg 2 272 × 1 892; 2,01 MB
-
 Borgchart.jpg 716 × 533; 49 KB
-
 Budget curve.png 700 × 500; 25 KB
-
 Burgernomics The Big Mac Index.png 800 × 1 800; 445 KB
-
 Canteras de Establiments.jpg 3 000 × 4 000; 2,24 MB
-
 Captura de pantalla 2023-04-16 150842.png 693 × 407; 28 KB
-
 Carte siège sociaux CA.png 1 071 × 749; 207 KB
-
 Central Bank legislative reforms (1972–2017).jpg 2 474 × 1 785; 286 KB
-
 Chart 123.png 45 × 21; 1 KB
-
 Chart 1234.png 47 × 21; 1 KB
-
 Chart12.png 80 × 44; 2 KB
-
 Chiffres de Joseph Caillaux.png 941 × 527; 62 KB
-
 CircularFaPNG.png 674 × 743; 129 KB
-
 CircularFlowFa.svg 646 × 711; 522 KB
-
 Comparative advantage.svg 512 × 473; 11 KB
-
 Current account balance (% of GDP).png 1 552 × 994; 697 KB
-
 Current Account Balance.pdf 1 275 × 1 650, 6 pagini; 147 KB
-
 Data-driven vs data-brokering.png 1 420 × 610; 200 KB
-
 Difference between Data-Driven Companies and Data Bounty Hunter Companies.png 1 566 × 676; 252 KB
-
 Differences of Microeconomics and Macroeconomics.svg 512 × 358; 290 KB
-
 Discretionary Spending 2019 Budget.jpg 908 × 574; 67 KB
-
 Discretionary Spending 2019.jpg 1 092 × 657; 71 KB
-
 Discretionary Spending.jpg 1 119 × 717; 100 KB
-
 Document15.pdf 1 275 × 1 650, 88 pagini; 2,92 MB
-
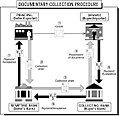 Documentary Collection.jpg 560 × 543; 39 KB
-
 E. Molendowski.jpg 556 × 624; 46 KB
-
 Economic Freedom and the Standard of Living.jpg 2 032 × 2 094; 410 KB
-
 Economic superstructure.jpg 1 125 × 1 197; 439 KB
-
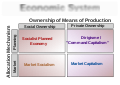
 Economic Systems Typology (v4).jpg 800 × 670; 215 KB
-
 Economic Systems Typology (v5).svg 1 123 × 794; 17 KB
-
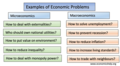 Economics problems.png 1 000 × 549; 201 KB
-
 Economics word bubble.jpg 4 096 × 3 072; 265 KB
-
 Economics.jpg 980 × 503; 170 KB
-
Econominas. Pesquisa Dela, Paula Leme.wav 39 min 12 s; 395,67 MB
-
 Effect of income and substitution effects.jpg 3 853 × 1 661; 3,54 MB
-
 Effects of Investment in Education Sustainability in Quintuple Helix.png 1 587 × 781; 572 KB
-
 Ekonomicnost utrosaka.jpg 100 × 49; 5 KB
-
 Ekonomije sirine.jpg 439 × 85; 21 KB
-
 Ekonomisten III. Biltzarra.jpg 400 × 335; 42 KB
-
 Ermittlung des Jahresüberschuss.png 596 × 527; 81 KB
-
 Essay Markus Walser5000x7000.jpg 5 000 × 7 000; 6,33 MB
-
 Estados unidos mundo.jpg 1 280 × 853; 169 KB
-
 Evidence-action-vectorized.svg 512 × 171; 4 KB
-
 Evolution of the MRO rate and the HICP for the EU.png 1 426 × 854; 94 KB
-
 Exam Droit S".jpg 720 × 960; 61 KB
-
 Executives.jpg 3 872 × 2 592; 1,16 MB
-
 Farmacoeconomia.jpg 504 × 565; 43 KB
-
 FBI-Photo-2.jpg 3 872 × 2 592; 1,59 MB
-
 FBI-Photo.jpg 3 872 × 2 592; 1,16 MB
-
 Flujo circular de ingresos.jpg 1 280 × 720; 40 KB
-
 Formula of Price Elasticity Of Demand 2.png 39 × 38; 577 bicoki*
-
 Foto-ESE-Nash-96-1280x580.webp 1 280 × 580; 82 KB
-
 Frances Stewart Ox PPE.jpg 1 440 × 1 080; 170 KB
-
 Frédéric Bastiat - The State.pdf 1 275 × 1 650, 82 pagini; 2,38 MB
-
 Game Theory Example.png 1 032 × 264; 33 KB
-
 Gecombineerde legenda.PNG 738 × 308; 16 KB
-
 Geschäftsmodell-Technologie-Portfolio.png 711 × 683; 79 KB
-
 Get14c.jpg 9 921 × 14 031; 12,38 MB
-
 GWS-LogoNeu.png 496 × 116; 10 KB
-
 Humanconomics Conference 2023.jpg 4 032 × 3 024; 3,98 MB
-
-
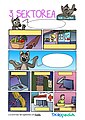
 Ikasi Otsorekin. Ekonomiaren 3. sektoreari buruzko komikia.jpg 2 481 × 3 510; 2,67 MB
-
 Ilustração - CAPITALISMO DISTRIBUTIVO.png 896 × 704; 567 KB
-
 Index economic complexity.png 6 300 × 3 120; 1,05 MB
-
 Inflación wikipedia.png 800 × 431; 167 KB
-

-

-
 Ingreso Nacional de México 1929-1945.jpg 2 498 × 1 920; 1,09 MB
-
 Innovatsionjarayonningbosqichlari.jpg 461 × 231; 17 KB
-
 Investimento.png 512 × 512; 20 KB
-
IPA pronounce M.Friedman.wav 0,6 s; 25 KB
-
 Jalada la Kitabu.jpg 640 × 640; 71 KB
-
 Japan.pdf 1 239 × 1 752; 112 KB
-
 Jaz BDP-a.jpg 3 072 × 4 096; 1,84 MB
-
-

-
 Jürgen Bodenseer, Barbara Thaler, Wolfgang Lusak.jpg 3 264 × 2 448; 2,54 MB
-
 K12 Economics Program Atlanta 2022.jpg 4 032 × 3 024; 6,29 MB
-
 Kalendar platezhіv Fondy.png 490 × 390; 15 KB
-
 Kausalkette.svg 600 × 250; 16 KB
-
 Key economic diagrams.png 1 280 × 720; 82 KB
-
 Killer B Pseudo-reorganization acquisition diagram.png 1 280 × 720; 59 KB
-
 Kirchgeorg Forschungsfelder HHL.jpg 1 483 × 1 027; 178 KB
-
 Kisima Kaya a Pedestrian Village in Kenya.jpg 568 × 600; 324 KB
-
 Kompleks ekonomicnosti.jpg 118 × 56; 4 KB
-
 Konjunktur & Salden (Saldenmechanik).png 1 022 × 603; 23 KB
-
 Köpprocessen.png 709 × 61; 7 KB
-
 Köztelekelső.png 627 × 893; 341 KB
-
 L model.jpg 200 × 157; 8 KB
-
 LagrangeHidalgo.jpg 854 × 456; 70 KB
-
 Learning curve example from WWII production in the US airframe industry.jpg 1 362 × 985; 504 KB
-
 Leistungsbilanz (Zwillingsdefizit vs Nettoexport).png 1 280 × 951; 86 KB
-
 Les trois pôles de la philosophie économique selon Villey (1960).png 1 638 × 1 272; 113 KB
-
 Les trois pôles de la philosophie économique selon Villey (1960).svg 1 063 × 854; 11 KB
-
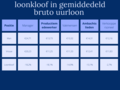 Loonkloof.png 1 024 × 768; 68 KB
-
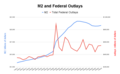
 M2 and Federal Outlays.png 1 068 × 660; 51 KB
-
 M2 and Federal Outlays2.png 1 068 × 660; 51 KB
-
 Mandatory Spending.jpg 792 × 470; 51 KB
-
 Manuela-Kasper Claridge - Economic Forum Polen.png 699 × 449; 624 KB
-
 Manufacturing employment in Springfield, Ohio.png 1 936 × 950; 208 KB
-
 Marcet - L’économie politique en vingt-deux conversations, 1837.pdf 750 × 1 212, 402 pagini; 11,21 MB
-
 Mashovi familija dnevnik.jpg 539 × 397; 47 KB
-
 Max Neuhaus, Generalbevollmächtigter und Direktor der AEG.jpg 567 × 365; 130 KB
-
Media and Democracy in Kansas City and Elsewhere.webm 54 min 14 s, 1 280 × 720; 157,98 MB
-
 Metody Realizacji Projektu Budowlanego.jpg 4 200 × 3 000; 1,34 MB
-
 Modèle IAD (Ostrom et al., 1994) (Holland et Sene, 2010).png 1 510 × 1 008; 103 KB
-
 Modèle IAD (Ostrom et al., 1994) (Holland et Sene, 2010).svg 992 × 698; 95 KB
-
 Mr Cadrick Chimuti speaks at The TASIP Business Meeting 2024.jpg 720 × 1 280; 106 KB
-
 Negative and zero interest rate map.png 2 000 × 1 398; 281 KB
-
 Nettokreditaufnahme (Gesamtwirtschaftlicher Bedarf).png 1 000 × 571; 48 KB
-
 Neuroeconomics influence vs. choice.jpg 850 × 623; 92 KB
-
 New Deal Conference 2023.jpg 4 890 × 3 171; 9,42 MB
-
 NIP pět kroků.jpg 988 × 522; 95 KB
-
 NIP tabulka investic 2020 až 2050 dle ministerstev.jpg 381 × 395; 67 KB
-
 NIP titulní strana.jpg 635 × 860; 47 KB
-
 NL-DvHCO 1417 2019 0001.jpg 2 661 × 3 728; 1,73 MB
-
 Nullsummen- (Profit & Defizit) Salden.png 918 × 768; 29 KB
-
 Obwarzanek (model ekonomiczny).jpg 1 642 × 1 671; 327 KB
-
 Oscilujici pavučina.png 575 × 506; 488 KB
-
 PERO.jpg 964 × 1 356; 47 KB
-
 Períodos históricos e socioeconômicos.png 932 × 440; 59 KB
-
 Pestoffův trojúhelník..jpg 756 × 648; 67 KB
-
 Pestoffův trojúhelník.png 451 × 390; 43 KB
-
 PLadder.png 889 × 337; 73 KB
-
 Platіzhnі platformi dlya sajtіv іnternet magazinіv.png 828 × 391; 37 KB
-
 Postup tvorby.gif 901 × 186; 14 KB
-
 Preference example.svg 1 084 × 246; 7,81 MB
-
 Price and Cost Relation.jpg 4 032 × 3 024; 1,59 MB
-
 Prijom platezhіv v odin klіk Fondy.png 1 102 × 617; 110 KB
-
 Prof. Djouadi noureddine.jpg 424 × 519; 50 KB
-
 Prof. Dr. Hab. Roman Kisiel podczas wyróżnień seminarzystów.jpg 1 080 × 1 181; 153 KB
-
 Quadruple helix.jpg 1 280 × 720; 49 KB
-

-
 RVL 4.jpg 1 366 × 578; 168 KB
-
 RVL 7.jpg 1 366 × 578; 162 KB
-
 Répartition du patrimoine en France en 1909 par catégories.png 809 × 526; 32 KB
-
 Sample Product Receipt.jpg 1 739 × 1 238; 82 KB
-
 Schuldenbremse (Saldenmechanik).png 1 367 × 774; 66 KB
-
 Schuldenbremse² (Leistungsbilanzbremse).png 800 × 401; 62 KB
-
 Schéma Teórie zmeny ekonomiky.jpg 2 225 × 1 202; 384 KB
-
 Sec Rubro economico.jpg 1 142 × 528; 86 KB
-
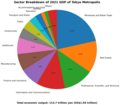 Sector Breakdown of 2021 GDP of Tokyo Metropolis.png 1 232 × 1 083; 143 KB
-
 Sectoral balances circuit diagram.png 1 393 × 782; 42 KB
-
 Simple diagram for price signal Miao Zou.png 841 × 577; 48 KB
-
 Sistema Económico - Economipedia.jpg 942 × 550; 210 KB
-
 Skizze des Wirtschaftsliberalismus.jpg 745 × 433; 40 KB
-
 Sound Money Conference 2018.jpg 883 × 589; 107 KB
-
 Spesa per la protezione sociale in percentuale sul PIL (2018).png 1 240 × 1 578; 121 KB
-
 Stepen ekonomicnosti 1.jpg 359 × 78; 17 KB
-
 Stepen ekonomicnosti 2.jpg 359 × 78; 17 KB
-
 Stepen ekonomicnosti 3.png 626 × 85; 6 KB
-
 Stepen ekonomicnosti 4.jpg 437 × 88; 24 KB
-
 Stepen ekonomicnosti 5.png 602 × 82; 6 KB
-
 Stepen ekonomicnosti.jpg 437 × 88; 20 KB
-
 SVG Gecombineerde legenda.svg 738 × 308; 12 KB
-
 Sweden-gdp-gross-domestic-product.png 580 × 498; 21 KB
-
 Tax salience.jpg 640 × 480; 174 KB
-
 Teilnehmer an der Pitch-Arena.jpg 3 500 × 2 333; 5,35 MB
-
 TETEANTONIO African Union President and Prof. Nelson K Bame.jpg 417 × 312; 52 KB
-
 The Colonial Origins of Comparative Development.jpg 613 × 809; 174 KB
-
 The dematerialization route.png 1 064 × 583; 120 KB
-
 The free riding issue in the Public Goods game.png 1 888 × 508; 300 KB
-
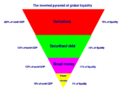 The inverted pyramid of global liquidity.gif 1 309 × 984; 22 KB
-

-
 Time Price of 1 ounce of Hershey Chocolate from 1938 to 2009.png 3 323 × 1 993; 124 KB
-
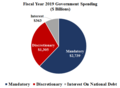 Total Government Spending 2019.png 539 × 396; 23 KB
-
 Towards a New Economic Order.jpg 2 045 × 1 417; 769 KB
-
 Trade-secret.jpg 700 × 446; 66 KB
-
 Transferinnovation.png 593 × 352; 52 KB
-
 Turkiye Enflasyon Turkey inflation-1965-2023.png 4 100 × 1 649; 480 KB
-
 TurtleIsland4thFridayPotluck.jpg 4 640 × 3 480; 6,54 MB
-
 Types of integration.png 832 × 438; 36 KB
-
 UA-Wiki Economics Banner-TimePreference.jpg 300 × 300; 35 KB
-
 UA-Wiki Economics Banner-АвстрійськаШколаЕкономіки.jpg 300 × 300; 37 KB
-
 UA-Wiki Economics Banner-ЕкономічнаТеорія.jpg 300 × 300; 44 KB
-
 UA-Wiki Economics Banner-Хрематистика.jpg 300 × 300; 27 KB
-
 US Current Account Balance 2017 Computation.png 1 304 × 737; 209 KB
-
 V model.jpg 167 × 158; 8 KB
-
 Value Statistical Life Internationally.png 1 536 × 740; 75 KB
-
 Variazione-annuale-del-PIL 1990-2021.png 1 239 × 796; 58 KB
-
 Venezuela-Colombia.jpg 718 × 720; 153 KB
-
 VereinfachtesKreislaufmodell.svg 389 × 280; 14 KB


.jpg)


.png)


.jpg)
.svg)


.png)


.png)
.png)
.svg)


_(Holland_et_Sene,_2010).png)
_(Holland_et_Sene,_2010).svg)


.png)


_Salden.png)
.jpg)


.png)
.png)


.png)


