Category:International economics
Jump to navigation
Jump to search
Wikimedia category | |||||
| Upload media | |||||
| Instance of | |||||
|---|---|---|---|---|---|
| |||||
Subcategories
This category has the following 21 subcategories, out of 21 total.
Media in category "International economics"
The following 96 files are in this category, out of 96 total.
-
De-Weltwirtschaft.ogg 2.1 s; 21 KB
-
 2006reserves (forex and gold).PNG 1,425 × 625; 62 KB
-
 2013-04-AFI-Member Map.jpg 7,018 × 4,666; 3.98 MB
-
 Agrarpolitik.jpg 609 × 329; 21 KB
-
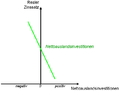
 Anstieg der ausländischen Nachfrage.png 466 × 595; 28 KB
-
 Anstieg der ausländischen Nachfrage.svg 406 × 498; 144 KB
-
 Anstieg der inländischen Nachfrage.png 444 × 577; 26 KB
-
 Anstieg der inländischen Nachfrage.svg 359 × 484; 125 KB
-
 Anteil Währungereserven.png 970 × 628; 25 KB
-
 Aussenhandel entwicklung deutschland.png 2,800 × 1,700; 67 KB
-
 Außenhandel und Konsummöglichkeitserweiterung.jpg 797 × 511; 57 KB
-
 Balancecourante.jpg 1,200 × 800; 58 KB
-
 Profit 2005.png 530 × 302; 93 KB
-
 WeltunternehmenGewinn.jpg 591 × 497; 79 KB
-
 WeltunternehmenGewinn.PNG 591 × 497; 139 KB
-
 BIS EER Real.png 3,600 × 2,400; 122 KB
-
 Cout-benef-UEM.png 280 × 258; 6 KB
-
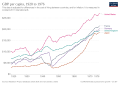
 Cumulative Current Account Balance per capita.png 1,800 × 820; 229 KB
-
 Cumulative Current Account Balance.png 1,800 × 820; 239 KB
-
 Current Account Balance % GDP 2006.PNG 1,425 × 625; 56 KB
-
 Current Account Balance 2006.png 1,425 × 625; 56 KB
-
 Current Account Balance per capita 2006.PNG 1,425 × 625; 55 KB
-
 D-dayslogosmall.jpg 268 × 30; 6 KB
-
 Das Gütermarktgleichgewicht.jpg 1,079 × 1,011; 266 KB
-
 Devisenmarkt.png 755 × 568; 16 KB
-
 DiagSwana.PNG 506 × 375; 12 KB
-
 Double Irish with a Dutch Sandwich.svg 400 × 200; 87 KB
-
 Durchschnittliches Produktivitätswachstum.png 1,302 × 753; 16 KB
-
 Effekte einer Exportsubvention.jpg 528 × 385; 26 KB
-
 Energy use per person.svg 850 × 600; 169 KB
-
 ExpUA5year.gif 967 × 724; 106 KB
-
 Faktorpreise und Faktoreinsatzkombinationen.jpg 944 × 555; 36 KB
-
 Faktorpreise und Güterpreise.jpg 966 × 699; 45 KB
-
 ForexReserves.png 1,600 × 728; 123 KB
-
 GlobalTrade wheat coarse grain soy 2008 usda.png 431 × 327; 5 KB
-
 GM - ForexReserves.svg 1,600 × 728; 1.83 MB
-
 GNI per capita.jpg 6,300 × 3,095; 817 KB
-
 Grafische Verdeutlichung der Realisierung von Außenhandelsgewinnen.JPG 2,466 × 1,309; 196 KB
-
 Handel und Industrie St. Gallen.jpg 4,504 × 2,340; 5.14 MB
-
 Handelsbilanzausgleich.png 376 × 364; 17 KB
-
 Handelsbilanzen im Vergleich D-USA.png 969 × 602; 43 KB
-
 Ho modell.JPG 647 × 450; 34 KB
-
 Holders of the National Debt of the United States.gif 737 × 503; 32 KB
-
 ImpUA5year.gif 931 × 698; 84 KB
-
 International Labor Mobility Graph.png 700 × 450; 23 KB
-
 International Union for the Protection of New Varieties of Plants.png 1,357 × 628; 54 KB
-
 J-Kurve2.png 494 × 262; 6 KB
-
 Krzywa reakcji Kraju Bertrand.jpg 562 × 558; 20 KB
-
 Krzywa reakcji Kraju.jpg 586 × 598; 26 KB
-
 Kurs stopa parytet.svg 325 × 454; 10 KB
-
 Kurs.jpg 640 × 400; 31 KB
-
 Land Labour Graph.jpg 423 × 753; 64 KB
-
 Ma history.jpg 2,718 × 2,025; 4.94 MB
-
 Major international economic organizations.GIF 695 × 621; 82 KB
-
 Marché de l'or.JPG 542 × 402; 28 KB
-
 Marginal Product of Labor Drawing.png 600 × 450; 29 KB
-
 Mehrere Güter.svg 685 × 558; 6 KB
-
 MENA map.png 700 × 400; 13 KB
-
 MENA.png 700 × 400; 86 KB
-
 Mercato dell'oro.svg 1,084 × 720; 20 KB
-
 Miembros alalc.PNG 1,359 × 630; 53 KB
-
 Military.svg 1,800 × 820; 433 KB
-
 Model doganiania cyklu produktu K.Akamatsu.JPG 397 × 335; 18 KB
-
 Modellannahmen mit identischer Faktorausstattung Beispiel.jpg 473 × 320; 44 KB
-
 Nachkriegsboom.svg 850 × 600; 55 KB
-
 NAU Stars.png 779 × 815; 29 KB
-
 Netto-Direktinvestitionen in Österreich 1997-2008.jpg 400 × 432; 31 KB
-
 Netto-Kapitalzuflüsse nach Österreich 2008.jpg 400 × 431; 36 KB
-
 NFI.png 644 × 488; 8 KB
-
 Nominal GDP IMF 2008 millions of USD.jpg 531 × 311; 27 KB
-

-
-
 Plastic waste generation by industrial sector, OWID.svg 850 × 600; 6 KB
-
 Pppgdp vers gdp in oecd swedish.svg 548 × 588; 39 KB
-
 Praxisbeispiel-Dollarabwertung.png 800 × 391; 49 KB
-
 Scatter.$1t.gdp.jpg 1,114 × 532; 29 KB
-
 Share of global GDP projected to 2050.png 945 × 531; 19 KB
-
 Stocks to use ag Indicators market 1977 2007.png 502 × 330; 39 KB
-
 Stolper-Samuelson-Beispiel.png 580 × 381; 74 KB
-
 Stolper-Samuelson-Theorem-Beispiel.png 580 × 381; 74 KB
-
 Theorie der Exportsubvention.jpg 578 × 315; 20 KB
-
 TradeBalanceUA.gif 1,005 × 715; 144 KB
-
 Transformationskurve-inland.svg 667 × 482; 55 KB
-
 Transformationskurve2.svg 533 × 457; 3 KB
-
 Unternehmensansiedlungen in Österreich 2000-2008.jpg 400 × 248; 18 KB
-
 VISTA(economics).png 1,350 × 625; 31 KB
-
 Von Güterpreisen zur Inputwahl.jpg 1,256 × 614; 79 KB
-
 Weltgleichgewicht.svg 585 × 331; 7 KB
-
 Weltmarkt.jpg 1,195 × 711; 88 KB
-
 Weltwirtschaftswachstum.png 908 × 681; 55 KB
-
 World Bank Group.png 1,357 × 628; 39 KB
-
 World international reserves june 2007.png 2,753 × 1,400; 176 KB
-
 Визначення RCA.png 421 × 346; 74 KB
-
 Девід Юм.jpg 273 × 300; 15 KB
-
 Об'єкти МЕВ.jpg 917 × 547; 244 KB
-
 Схема МЕВ 1.jpg 498 × 589; 120 KB
.PNG)


.png)


