Category:Economy of the United States
Here nagîvasyonê
Here lêgerînê
national economy of the United States  | |||||
| Medya bar bike | |||||
| Mînakek ji bo | |||||
|---|---|---|---|---|---|
| Subclass of | |||||
| Dirav | |||||
| PPP GDP per capita |
| ||||
| GDP (PPP) |
| ||||
| Nominal GDP |
| ||||
| Nominal GDP per capita |
| ||||
| Real GDP growth rate |
| ||||
| Inflation rate |
| ||||
| Total reserves |
| ||||
| Cih | Dewletên Yekbûyî yên Amerîkayê | ||||
| |||||
Binkategorî
Di vê kategoriyê de 77 binkategorî hene. Jêr 77 binkategorî tên nîşandan.
*
2
A
B
C
D
E
- Eviction in the United States (34 F)
F
G
H
I
L
M
N
O
P
R
S
T
- TED Spread (6 F)
U
W
Z
- Zenith Provecta (6 F)
Medya di kategoriya "Economy of the United States" de
Di vê kategoriyê de 174 dane hene. Jêr 174 dane tên nîşandan.
-
 "Here's how!" - Kep. LCCN2011647348.jpg 4315 x 5606; 4,47 MB
-
12-30 Crisis at the Post Office.ogv 28 d 39 s, 854 × 480; 213,11 MB
-
 1832bank1.jpg 1955 x 1309; 609 KB
-
 2012 Combined US Federal and State Effective Tax Rates.jpg 517 x 371; 42 KB
-
20161008 Weekly Address HD.webm 3 d 14 s, 1920 × 1080; 43,1 MB
-
 2023 banking crisis bank deposits.webp 3763 x 1189; 131 KB
-
Analysis of FedEx ($FDX) - Stock Investment Research.webm 24 d 57 s, 1920 × 1080; 59,45 MB
-
 Average annual change in unemployment rate by president.png 1720 x 1036; 39 KB
-
 Average Interest Rate on U.S. Federal Debt.webp 4502 x 1601; 67 KB
-
 Black Friday 1869.jpg 1024 x 893; 453 KB
-
 BradyBondFig.png 2321 x 1159; 181 KB
-

-
 Businesscycle figure1.jpg 410 x 327; 16 KB
-
 Businesscycle figure2.jpg 396 x 327; 17 KB
-
 Businesscycle figure3.jpg 407 x 327; 27 KB
-
 Cafta countries.png 456 x 342; 10 KB
-
 Canals USA 1825.png 960 x 930; 195 KB
-
 CARES ACT - Relief Amounts.png 1271 x 732; 77 KB
-
 CARES Act Sankey Diagram.png 2000 x 2150; 220 KB
-
 CBO 1981 forecast of impact of Reagan tax cuts vs baseline.png 1376 x 787; 207 KB
-
 Child workers in River Point, RI.jpg 582 x 415; 71 KB
-
 Clinton - Trends in Revenues and Outlays v1.png 1381 x 717; 140 KB
-
 CommonGround Food Prices Infographic (11718170676).jpg 2078 x 3300; 1,68 MB
-
Conservatives are destroying Ben Franklin's best invention - The Post Office.ogv 4 d 56 s, 654 × 480; 30,9 MB
-
 Des Vacances de Malade Mental.png 800 x 900; 207 KB
-
 Diagram of the Double Irish with a Dutch Sandwich BEPS tool.png 395 x 545; 188 KB
-

-
 Double Saving Art.IWMPST15546.jpg 466 x 714; 46 KB
-
 Droit de douane (Etats-Unis).png 466 x 335; 29 KB
-
 Economic connections between US, EU, China, Russia and India.png 492 x 522; 41 KB
-
 Employment by economic sector, OWID.svg 850 x 600; 15 KB
-
EN Gold Standard.ogg 25 d 11 s; 17,43 MB
-
 Entreprises américaines 2008.svg 528 x 381; 104 KB
-
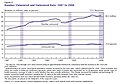
 Establishments by us sector 1997-2007.svg 1361 x 551; 113 KB
-

-
 Estados-Unidos-All-Expo-2604-Ano.png 758 x 480; 23 KB
-
 Extreme weather in the US 1980-2011-tr.png 800 x 536; 494 KB
-
 Extreme weather in the US 1980-2011.png 800 x 536; 471 KB
-
 Families US Historical.png 518 x 312; 16 KB
-
 Families US.png 339 x 343; 10 KB
-
 Families US.svg 630 x 530; 19 KB
-
 Flohri cartoon about the Philippines as a bridge to China.jpg 992 x 797; 235 KB
-
 Foreign Born in U.S. Number and Share 1900-2019.png 1383 x 787; 59 KB
-
 FSANetCost2006.png 786 x 414; 70 KB
-
 FTAs with the United States.svg 1104 x 566; 1,41 MB
-
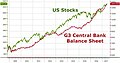 G3 Cental Bank Balance Sheets versus US Stocks (2009-2017).jpg 600 x 315; 38 KB
-
 G3 Central Bank Balance Sheets (2004-2017).jpg 956 x 501; 118 KB
-
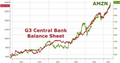 G3 Central Bank Balance Sheets versus Amazon Share Price (2012-2017).png 500 x 264; 111 KB
-
 G3 Central Bank Balance Sheets versus US Tech Stocks (2006-2017).jpg 588 x 218; 30 KB
-
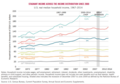
 G7 Countries GDP Per Capita (1990-2029).png 2379 x 1380; 380 KB
-
 GDP to Federal debt of the United States.png 1421 x 474; 70 KB
-
 ENERGY AND THE RURAL ECONOMY- THE IMPACTS OF OIL AND GAS PRODUCTION (IA gov.gpo.fdsys.CHRG-114hhrg99852).pdf 1275 × 1650, 41 rûpel; 293 KB
-
 Government and State-Owned Enterprises to GDP for United States.png 1427 x 470; 63 KB
-
 Gramm-Leach-Bliley Vote 1999.png 2500 x 1441; 139 KB
-
 Graph circulaire emploi par etat USA 2005.svg 433 x 276; 51 KB
-
 Grover Cleveland and Wilson-Gorman Tariff Cartoon.jpg 772 x 1112; 205 KB
-
 Growth1929-52.jpg 510 x 557; 65 KB
-
 Henry Clay - Project Gutenberg eText 16960.png 1106 x 828; 179 KB
-
 High-yield bond and bank loan mutual fund assets 2003-2019.svg 512 x 326; 52 KB
-
 Historical WSJ Prime Rate 1947 to June 2022.svg 640 x 480; 30 KB
-
 Illustration-of-New-Lease-Accounting-TRIRIGA.jpg 673 x 517; 122 KB
-
 Imported cars as a percent of vehicles sold in the US.png 1180 x 900; 96 KB
-
 Imports and exports of the United States with other countries.png 788 x 819; 169 KB
-
 Imports of goods and services (% of GDP) - 2022 - World Bank.png 400 x 922; 37 KB
-
 IncomeRedistributionOnHouseholdSpending.png 991 x 526; 30 KB
-
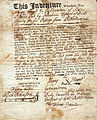 Indenturecertificate.jpg 320 x 395; 35 KB
-
 JamesMontgomeryFlagg-UncleSamWithEmptyTreasury1920Large.jpg 640 x 724; 281 KB
-
 Jb progress taxday 2 e.jpg 283 x 192; 10 KB
-
Jobs with Justice, Occupy Tucson, and Union Workers march to save postal jobs.ogv 5 d 13 s, 854 × 480; 72,11 MB
-

-
 Lorenz curve usa.png 504 x 464; 50 KB
-

-
 M0-Money supply of the USA.jpg 1168 x 450; 98 KB
-
 Mandatory Spending for FY 2016.png 1020 x 633; 55 KB
-
 Maquiladora.JPG 2272 x 1704; 1,41 MB
-
 Metric-america.gif 160 x 100; 3 KB
-
 Money supply of the USA.png 1168 x 450; 101 KB
-
 Mortgage loan fraud.svg 725 x 407; 4 KB
-
 National debt of the United States.webp 3701 x 2133; 80 KB
-
 New Zealand Dollar - USD Exchange Rate.webp 1536 x 407; 36 KB
-
 New-Lease-Accounting-Standard-Timeline-TRIRIGA.jpg 1108 x 451; 90 KB
-
 Ograbme.jpg 1000 x 789; 186 KB
-
 Origins registration.jpg 1600 x 1200; 569 KB
-
 Outlays.png 1409 x 959; 109 KB
-
 OutlaysZoom.png 1409 x 959; 73 KB
-
 Per capita US income.svg 720 x 360; 41 KB
-
 Percentage of US households that own cars.png 1064 x 714; 96 KB
-
 PostcardToCanadaForInvestmentInCanada1907.jpg 644 x 406; 109 KB
-
 Present-vs-New-Lease-Accounting-TRIRIGA.jpg 1175 x 667; 131 KB
-
 President McKinley as Old Mother Hubbard 1897 cartoon.jpg 896 x 592; 157 KB
-
President Obama Delivers Remarks on the Economy.webm 57 d 8 s, 1280 × 720; 613,12 MB
-
 PSM V58 D647 United states manufacture in the world market.png 2891 x 1555; 336 KB
-
-
 Real family income indexed to 1973, across the distribution 1947-2014.png 1110 x 711; 134 KB
-
 Real GDP growth by U.S. President - Eisenhower to Obama v1.png 1355 x 773; 33 KB
-
 Recessions 2000-2015.JPG 814 x 444; 46 KB
-
 Salario medio annuo in dollari.png 868 x 568; 64 KB
-
 Schooner Telegraph.jpg 1497 x 1071; 260 KB
-
 Scorecard Trump vs. Obama.png 1398 x 791; 108 KB
-
 Securitization Market Activity.png 960 x 720; 79 KB
-
 Securitization Market Activity.svg 709 x 709; 52 KB
-

-

-
 State-credit-rating-fitch-May21.png 2560 x 1583; 282 KB
-
 State-credit-rating-Moody's-May21.png 2560 x 1583; 284 KB
-
 State-credit-rating-S&P-May21.png 2560 x 1583; 286 KB
-
 TAFTA.png 3452 x 1578; 646 KB
-
Takin it to the streets - The Postal Service is hiring!.ogv 33 s, 1920 × 1080; 34,29 MB
-
 Taylor Rule Prescriptions for Fed Funds Rate 2016.png 984 x 739; 256 KB
-
 Technology administration l.png 113 x 114; 4 KB
-
 The New York Clearing House, Oval Table.jpg 1060 x 672; 128 KB
-
The Violent Truth About USPS.webm 23 d 51 s, 1280 × 720; 184,32 MB
-
 Three Cs.jpg 1178 x 670; 206 KB
-

-
 Township.png 633 x 669; 66 KB
-
 U.S. Commercial Real Estate Property Price Index.JPG 963 x 803; 90 KB
-
 U.S. Credit Index.JPG 958 x 795; 99 KB
-
 U.S. Exaction of Tribute.png 661 x 1006; 124 KB
-
 U.S. federal government revenues and expenditures in the 1980s.png 1008 x 565; 33 KB
-
 U.S. GDP Income Basis.png 1246 x 634; 65 KB
-
 U.S. Health Insurance Status - Under 65 yrs.png 960 x 720; 68 KB
-
 U.S. Housing Index.JPG 958 x 799; 89 KB
-
 U.S. in global economy.png 868 x 376; 44 KB
-
 U.S. Income Index.JPG 957 x 810; 91 KB
-
 U.S. Income Share of Top 1% of Households CBO & P-S 1979-2011.png 885 x 502; 85 KB
-
 U.S. Inflation Index.JPG 956 x 796; 88 KB
-
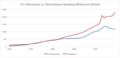 U.S. Mandatory vs. Discretionary Spending (1966-2015).png 1102 x 533; 46 KB
-
 U.S. manufacturing employment.png 894 x 476; 98 KB
-
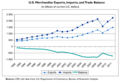 U.S. Merchandise Exports, Imports, and Trade Balance.png 871 x 602; 70 KB
-
 U.S. merchandise trade balance (1895-2015).png 1124 x 588; 49 KB
-
 U.S. Merchandise Trade Balance (2011).png 667 x 636; 52 KB
-
-
 U.S. real median household income, 1967-2014.png 1047 x 732; 216 KB
-
 U.S. Retail Index.JPG 955 x 793; 90 KB
-
 U.S. Trade Balances Total Trade, Energy Trade, and No Energy Trade.png 868 x 587; 114 KB
-
 U.S. Trade Balances Total Trade, Energy Trade.png 896 x 603; 114 KB
-
 U.S. trade mission in sevilla 2.jpg 400 x 303; 97 KB
-
 U.S. Uninsured and Uninsured Rate (1987 to 2008).JPG 591 x 415; 46 KB
-
 United States - Chain store sales.png 2550 x 1200; 129 KB
-
 United States Federal Government debt.webp 3556 x 2265; 88 KB
-
 United States GDP.webp 5308 x 2080; 91 KB
-
 United States imports.png 1730 x 570; 160 KB
-
 United States trade deficits with other countries.png 3000 x 1080; 146 KB
-
 United States trade of passenger cars.png 1200 x 572; 44 KB
-
 United States trade with china history.gif 340 x 280; 9 KB
-
UPS, FedEx, USPS 2018 Shipping Price Changes What You Need to Know.ogv 57 d 55 s, 854 × 480; 188,69 MB
-
 US Commercial Property Price Index Inputs.JPG 966 x 688; 104 KB
-
 US corporate bonds held by mutual funds 2001-2019.svg 512 x 323; 26 KB
-
 US Credit Index Inputs.JPG 969 x 693; 93 KB
-
 US FTA Negotiations as of May 2008.png 1559 x 622; 37 KB
-
 US FTAs.PNG 1427 x 628; 56 KB
-
 US gross external debt position by sectors.png 1200 x 1000; 62 KB
-
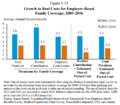 US Health Insurance Premiums for Families - 1999 to 2014.png 753 x 658; 279 KB
-
 US map top-50-computer-science-universities.svg 2098 x 1396; 831 KB
-
US Postal Service Wants Congress to Make Changes to Its Business Model.ogv 3 d 57 s, 640 × 480; 35,59 MB
-
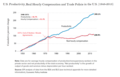
 US productivity and earnings.jpg 875 x 565; 57 KB
-
 US share of world GDP since 1980.jpg 847 x 277; 38 KB
-
 US Soy - China Timeline Infographic (11717398335).jpg 1919 x 2770; 629 KB
-
 US Soy Exports Infographic (11717396995).jpg 1800 x 1200; 715 KB
-
 US to China Soybean Exports Infographic (11717397845).jpg 1542 x 3300; 1,18 MB
-
USA for 6 DAY Rally with Dallas Postal Workers.ogv 5 d 30 s, 1280 × 720; 229,93 MB
-
 UScomputerpatents.svg 512 x 559; 70 KB
-
 USD Belarusian Ruble Exchange Rate.webp 4333 x 979; 99 KB
-
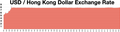 USD to Hong Kong Dollar exchange rate.webp 1513 x 400; 16 KB
-
 USD to Indonesian Rupiah exchange rate.webp 1584 x 381; 28 KB
-
 USD to Philippine Peso exchange rate.webp 1586 x 387; 26 KB
-
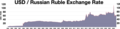 USD to Russian Ruble exchange rate.webp 1629 x 391; 30 KB
-
 USD to South Korean Won exchange rate.webp 1663 x 411; 28 KB
-
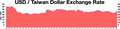 USD to Taiwan Dollar exchange rate.webp 1560 x 382; 25 KB
-
 USD to Thai Baht exchange rate.webp 1604 x 381; 25 KB
-
 What did the United States import in 2012.png 750 x 520; 125 KB
-
 What the US imports.png 1122 x 827; 244 KB
-
 WSJ Prime Rate Changes.svg 640 x 480; 29 KB
-


.jpg)


.png)


.jpg)
.jpg)
.png)
.png)


_-_2022_-_World_Bank.png)


_sales_in_USA_(2011-2022).png)


.png)


.png)
.png)
.png)


.JPG)


.jpg)
.jpg)
.jpg)


_%D0%B8_%D0%BF%D0%BE%D1%87%D0%B0%D1%81%D0%BE%D0%B2%D0%BE%D0%B9_%D0%BE%D0%BF%D0%BB%D0%B0%D1%82%D1%8B_(Compensation)_%D0%B2_%D0%A1%D0%A8%D0%90_%D1%81_1948_%D0%B3%D0%BE%D0%B4%D0%B0.jpg)
.jpg)
.png)