Category:Economy of France
Jump to navigation
Jump to search
Countries of Europe: Albania · Andorra · Armenia‡ · Austria · Azerbaijan‡ · Belarus · Belgium · Bosnia and Herzegovina · Bulgaria · Croatia · Cyprus‡ · Czech Republic · Denmark · Estonia · Finland · France‡ · Georgia‡ · Germany · Greece · Hungary · Iceland · Republic of Ireland · Italy · Kazakhstan‡ · Latvia · Liechtenstein · Lithuania · Luxembourg · Malta · Moldova · Monaco · Montenegro · Netherlands‡ · North Macedonia · Norway · Poland · Portugal‡ · Romania · Russia‡ · San Marino · Serbia · Slovakia · Slovenia · Spain‡ · Sweden · Switzerland · Turkey‡ · Ukraine · United Kingdom · Vatican City
Specific status: Faroe Islands · Gibraltar · Bailiwick of Guernsey · Isle of Man · Jersey · Svalbard – Limited recognition: Abkhazia‡ · Kosovo · South Ossetia‡ · Transnistria · Northern Cyprus‡
‡: partly located in Europe
Specific status: Faroe Islands · Gibraltar · Bailiwick of Guernsey · Isle of Man · Jersey · Svalbard – Limited recognition: Abkhazia‡ · Kosovo · South Ossetia‡ · Transnistria · Northern Cyprus‡
‡: partly located in Europe
economy of the country .svg) | |||||
| Upload media | |||||
| Instance of | |||||
|---|---|---|---|---|---|
| Subclass of | |||||
| Currency | |||||
| PPP GDP per capita |
| ||||
| GDP (PPP) |
| ||||
| Nominal GDP |
| ||||
| Nominal GDP per capita |
| ||||
| Real GDP growth rate |
| ||||
| Inflation rate |
| ||||
| Total reserves |
| ||||
| VAT rate |
| ||||
| Location | France | ||||
| Currency | |||||
| Different from | |||||
| |||||
Subcategories
This category has the following 69 subcategories, out of 69 total.
*
A
B
C
E
- Emploi dans l'environnement (3 F)
F
- French government debt (14 F)
G
- Government budget of France (1 F)
H
I
L
M
N
O
P
- Patents from France (5 F)
- Population of France (7 F)
R
S
T
U
W
Z
Media in category "Economy of France"
The following 162 files are in this category, out of 162 total.
-
 2006French exports.PNG 1,425 × 625; 61 KB
-
 A festive crowd in a marketplace near a harbour in France in Wellcome V0048265.jpg 3,050 × 2,407; 4.03 MB
-
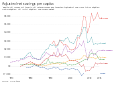 Adjusted net savings per capita, OWID.svg 850 × 600; 19 KB
-
 C.1868 Ernest Michaux and Michaudine velocipede invented in 1861.png 597 × 596; 390 KB
-
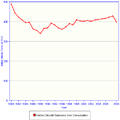 Carbon Dioxine Emissions from Consumption in France.png 500 × 500; 14 KB
-
 ChequeVacances.jpg 2,312 × 1,087; 1.21 MB
-

-
 Chronometre assembled.jpg 356 × 1,499; 95 KB
-
 CMA France.jpg 1,512 × 1,322; 1.61 MB
-

-
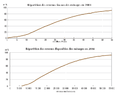
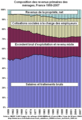 Composition des revenus primaires des ménages France 1959-2007.png 465 × 682; 27 KB
-
 Composition revenu ménage france.png 528 × 384; 20 KB
-
 Compétitivité et parts de marché de la France.png 984 × 568; 48 KB
-
 Consommation pré-engagée en France.PNG 817 × 483; 41 KB
-

-
 Croissance du PIB de la France et du G7 de 1980 a 2022.png 1,232 × 853; 94 KB
-
-
 Croissance pib habitant france.png 480 × 346; 19 KB
-
 Cumul allocation revenus.svg 464 × 391; 8 KB
-
 De Vauban, Projet d'une dixme royale, 1707.png 972 × 800; 764 KB
-
 Departments of Île-de-France by GDP (2021).jpg 2,249 × 1,687; 197 KB
-

-
 Echanges commerciaux france.png 680 × 412; 69 KB
-
 Echanges extérieurs France 1978-2007.png 1,023 × 627; 75 KB
-
 Echanges extérieurs.PNG 1,514 × 427; 36 KB
-
 Economic growth of France.jpg 1,013 × 650; 44 KB
-
 Effectifs physiques des trois versants de la fonction publique.png 1,200 × 665; 91 KB
-
 Effet redistribution.png 480 × 347; 14 KB
-

-
 Emploi écoactivités 2012.jpg 785 × 498; 125 KB
-
 EstradaFrança.jpg 551 × 383; 97 KB
-
-
 Evolution dette Portugal France.gif 596 × 337; 5 KB
-
 Evolution dette publique.gif 2,605 × 1,682; 38 KB
-

-
 Evolution du RSA en €.png 995 × 573; 20 KB
-

-
 Evolution of GNP of France from 1950 to 2012.png 1,143 × 387; 36 KB
-
 Expenditure and revenues, France, 1993-2006.png 1,154 × 736; 54 KB
-
-
-

-

-
 Fourastie.png 434 × 332; 2 KB
-
 France Trade Balance.png 680 × 412; 67 KB
-
 France-assurance-vieillesse-regime-general.svg 750 × 563; 64 KB
-
 France-assurance-vieillesse-regimes.svg 600 × 450; 37 KB
-
 France-chomeurs-categorie1.svg 750 × 563; 142 KB
-
 France-chomeurs-categorie123678.svg 600 × 450; 125 KB
-
 France-defaillances-entreprises.svg 960 × 720; 133 KB
-
 France-emplois-creations-industrie-construction-tertiaire.svg 750 × 563; 67 KB
-
 France-urssaf-cotisations-exonerations.svg 466 × 334; 72 KB
-
 French bonds.webp 5,438 × 1,672; 312 KB
-
 French economy 2016 - expenditures.png 563 × 469; 26 KB
-
 Friggit prix trans aout09.jpg 1,201 × 900; 142 KB
-
 Friggit prix trans juillet09.jpg 1,201 × 900; 141 KB
-
 G7 Countries GDP Per Capita (1990-2029).png 2,391 × 1,413; 317 KB
-
 GDP per capita big four Western Europe.PNG 911 × 623; 38 KB
-
 GDP per capita, Big Four countries, 1970–2009 (Maddison).png 3,400 × 2,400; 475 KB
-
 GDP-top-counties.gif 531 × 311; 28 KB
-
 Graphe Dépenses et recettes publiques, France,1993-2006.png 1,154 × 736; 37 KB
-
 Historical GDP growth - France.png 1,151 × 605; 45 KB
-
 Historique RdB 2013.jpg 715 × 434; 36 KB
-
 IDE France.PNG 552 × 310; 7 KB
-

-

-
 Impots.png 1,267 × 627; 27 KB
-
 Impôts sur le revenu (bas salaires).png 709 × 429; 32 KB
-
 Impôts sur le revenu (gros salaires).png 709 × 416; 31 KB
-
 Impôts sur le revenu.png 715 × 434; 29 KB
-
 Indice insee t3 2010.svg 512 × 410; 15 KB
-
 Inflation 2002 c.png 480 × 346; 58 KB
-
 Insee courbe.png 859 × 489; 197 KB
-
 Insee, CLAP (connaissance locale de l'appareil productif)..png 692 × 441; 22 KB
-
 InterestRGrowthDiff.PNG 959 × 593; 37 KB
-
 Investissement, épargne et autofinancement des entreprises.png 900 × 506; 52 KB
-
 Jacques Necker - Compte rendu au roi, 1781.djvu 1,179 × 1,500, 139 pages; 6.67 MB
-
 Julien Balkany.jpg 2,035 × 2,556; 831 KB
-
 KZinsDiff.PNG 970 × 604; 36 KB
-
 Les Parts De Marché Des Hyper En France.svg 591 × 810; 79 KB
-
 Logo ceca.jpg 100 × 44; 2 KB
-
 Logo EMBALLAGE.jpg 985 × 212; 35 KB
-
 Logo Manutention1.jpg 493 × 450; 27 KB
-
 Logo-Apart-France.jpg 352 × 60; 5 KB
-
 Logo-Cercle-K2.png 981 × 320; 21 KB
-
 Lorenz revenu france 2007.png 480 × 347; 18 KB
-
 Lorenz revenu france.png 480 × 347; 13 KB
-
 Mean Median Income FR 2004-2017 EUROSTAT.svg 512 × 284; 8 KB
-
-

-
 Naissances depuis 1900 en France.GIF 638 × 418; 8 KB
-
 Nombre de foyer fiscaux selon le revenu fiscal de référence (2016).png 1,231 × 534; 35 KB
-
 Okun70.png 1,056 × 816; 35 KB
-
 Orga EF.png 503 × 456; 52 KB
-

-

-
-

-
 Part salaire top 1 et 10 france.png 480 × 347; 18 KB
-
 Part succession france.png 480 × 347; 31 KB
-
 Partage de la valeur ajoutée en France.png 939 × 509; 47 KB
-
 Partage va.png 804 × 489; 58 KB
-
 Patrimoine net de 1978 à 2007 en valeur en France.jpg 700 × 323; 44 KB
-
 Pdt credit habitat t3 2010.svg 512 × 410; 25 KB
-
 Performance fonds.JPG 743 × 483; 44 KB
-
 PhotoLFA.jpg 639 × 360; 23 KB
-
 PIB par habitant de la France.png 674 × 422; 26 KB
-
 PIB par habitant en France 1820-2003.svg 512 × 361; 63 KB
-
 PreisindizesEngl.png 968 × 614; 35 KB
-
 PreisindizesKonsum.png 968 × 614; 34 KB
-
 Primeros socios de Francia (exportaciones).png 462 × 505; 10 KB
-
 Primeros socios de Francia (importaciones).png 520 × 516; 11 KB
-
 Principales excedentes y deficites de Francia en 2007.png 522 × 342; 10 KB
-
 Principaux excédents et déficits bilatéraux de la France en 2022.png 796 × 541; 40 KB
-
 Prix immobilier ancien 1996 2007.jpg 1,201 × 900; 91 KB
-
 PropriétéRepartitionFrance1780-2015.png 937 × 588; 142 KB
-
 Prélèvements obligatoires en France en 2007.svg 6,536 × 2,865; 239 KB
-
 Public Deficit of France.png 881 × 541; 124 KB
-
 Pyramide des âges France 2007.PNG 974 × 920; 67 KB
-
 Rapport interdécile france.png 480 × 347; 18 KB
-
 Recettes Etat France 2007.png 747 × 565; 29 KB
-
 Relatives GNP PPP European countries vs. USA 1990-2006.jpg 1,076 × 708; 104 KB
-
 RentUSAGerFraBri 02.png 767 × 625; 22 KB
-
 RentUSAGerFraBri.png 708 × 492; 9 KB
-

-
 Répartion France 2006 Valeur ajoutée.png 781 × 692; 92 KB
-
-
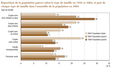
 Répartition des niveaux de vie par individu en 2004 en France.PNG 802 × 394; 16 KB
-
-
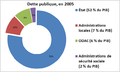 Répartition dette publique France 2005.png 613 × 370; 21 KB
-
 Répartition du patrimoine en France en 1909 par catégories.png 809 × 526; 32 KB
-

-
 Salario medio annuo in dollari.png 868 × 568; 64 KB
-
 Smic en eur h base 35 heures.png 497 × 340; 10 KB
-
 Solde commercial France 1995 - 2005.jpg 502 × 500; 51 KB
-
 Solde-budgetaire-France.png 890 × 581; 36 KB
-
 Structure de l'EBE.png 938 × 411; 33 KB
-

-
 Taux d'endettement France.png 907 × 492; 52 KB
-
 Taux d'inflation en France.png 638 × 534; 17 KB
-

-
 Taux de couverture France.PNG 588 × 459; 8 KB
-

-
 Taux de croissance 78-2008.png 1,186 × 461; 10 KB
-
 Taux de croissance Portugal France.gif 699 × 337; 5 KB
-

-
 Taux dette France 06-2011.jpg 575 × 817; 48 KB
-
 Thematiques-polev3.0.png 1,120 × 737; 83 KB
-
 Tombstone kaptech.jpg 2,112 × 2,816; 1.5 MB
-
 Tunnel friggit avril 2011.svg 512 × 410; 15 KB
-
 Tunnel friggit dec010.svg 512 × 410; 18 KB
-
 Tunnel friggit transaction prix.jpg 1,201 × 900; 142 KB
-
 Tximposreel.png 516 × 457; 8 KB
-
 VA par branche France 2010.png 1,280 × 728; 98 KB
-
 World GNI per capita compared to France 2011.svg 863 × 443; 1.66 MB
-
 ZinsWachsDiff.PNG 959 × 593; 21 KB
-

-
 Évolution du PIB en France.GIF 593 × 445; 8 KB
-

-
 Évolution SMIG-SMIC 1951-2016 V2.jpg 915 × 567; 67 KB
-
 Évolution SMIG-SMIC 1951-2016.jpg 915 × 567; 70 KB
-


.jpg)


.png)

.png)


_-_car_sales_(Italy_since_1928_-_Europe_since_2000).png)


.png)
.png)


..png)


.png)


.png)


.png)
.png)


_par_branches_en_France_de_1949_%C3%A0_2007.jpg)