Category:Financial economics
Jump to navigation
Jump to search
English: Financial economics

branch of economics concerned with financial or monetary transactions | |||||
| Upload media | |||||
| Instance of | |||||
|---|---|---|---|---|---|
| Subclass of | |||||
| Part of | |||||
| Has part(s) |
| ||||
| |||||
Subcategories
This category has the following 13 subcategories, out of 13 total.
Media in category "Financial economics"
The following 110 files are in this category, out of 110 total.
-
 Apmex wiki2.png 233 × 64; 13 KB
-
 APMEX-2009.jpg 800 × 364; 143 KB
-
 Arsbreytinglandsfr2000-8 English.png 1,426 × 977; 187 KB
-
 Avellum logo cut.jpg 300 × 62; 13 KB
-
 Beispiel ISMA.jpg 518 × 345; 29 KB
-
 Betavex.JPG 640 × 512; 14 KB
-
 BGR Logo (Small).png 172 × 35; 3 KB
-
 CharlesBiderman2007.jpg 252 × 251; 19 KB
-
 Binomial tree irates(es).png 513 × 329; 41 KB
-
 Blogger logo square webtreatsetc.png 64 × 64; 8 KB
-
 Borio2003.png 839 × 417; 47 KB
-
 CDO - FCIC and IMF Diagram.png 960 × 720; 434 KB
-
 CDS-default.PNG 628 × 477; 13 KB
-
 Company directors logo.png 285 × 41; 3 KB
-
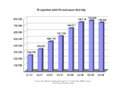
 Comparison of Portfolio Performance with and without Legal Alpha.jpg 1,008 × 757; 70 KB
-
 Congtyquanlyquyvietnam-vietnam-asset-management-VAM-Logo.jpg 189 × 44; 5 KB
-
 Cours action bnp paribas 2008.png 1,240 × 576; 23 KB
-
 Cours action bnp paribas.png 498 × 387; 17 KB
-
 Cours action credit agricole 2008.png 1,230 × 573; 23 KB
-
 Cours action credit agricole.png 498 × 397; 17 KB
-
 Cours action dexia 2008.png 1,226 × 590; 25 KB
-
 Cours action Dexia du 9 septembre 2008 au 25 février 2009.png 1,022 × 523; 29 KB
-
 Cours action dexia.png 498 × 402; 16 KB
-
 Cours action royal bank of scotland 2008.png 1,041 × 523; 30 KB
-
 Cours action societe generale.png 498 × 387; 17 KB
-
 Cours societe generale 2008.png 1,232 × 566; 27 KB
-
 Covered-interest-arbitrage.svg 448 × 227; 152 KB
-
 Covered-interest-rate-parity.svg 448 × 227; 159 KB
-
 CS Logo Circle.png 720 × 720; 21 KB
-
 CSFB logo.png 394 × 121; 5 KB
-
 Cumulative abnormal returns.JPG 629 × 416; 21 KB
-
 Diagramm Annuitätentilgung.png 923 × 641; 37 KB
-
 Diagramm AnnuitätentilgungRestschuld.png 923 × 641; 30 KB
-
 Distribuzione empirica.png 800 × 572; 5 KB
-
 DJIA - 14000.PNG 813 × 393; 19 KB
-
 Du-pont-schema.png 872 × 460; 21 KB
-
 DZañartuRio.jpg 411 × 549; 113 KB
-
 Eco 3.png 339 × 220; 31 KB
-
 Elite Forex Trades Signals.jpg 1,284 × 2,075; 1.28 MB
-
 Entwicklung der Staatsschuldenquote in Deutschland.png 1,807 × 1,119; 98 KB
-
 Epr797.gif 287 × 302; 6 KB
-
 ESI Chart.jpg 1,149 × 511; 68 KB
-
 EU financial transaction tax.svg 512 × 392; 506 KB
-
 Eurostat.png 379 × 350; 19 KB
-
 Existing Home Sales Chart - v 1.0.png 960 × 720; 23 KB
-
 FED.gif 761 × 403; 18 KB
-
 Final.JPG 800 × 591; 49 KB
-
 FIXatdl-StrategyPanels.png 835 × 609; 44 KB
-
 Flickr square webtreatsetc.png 64 × 64; 8 KB
-
 Foreclosure Trend - 2007.png 960 × 720; 10 KB
-
 Foreclosure Trend.png 960 × 720; 24 KB
-
 Forex signals.png 325 × 288; 13 KB
-
 GBarrosJ.jpg 200 × 260; 59 KB
-
 Gdp to debt ratio.svg 1,800 × 1,440; 377 KB
-
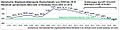 Historische Staatsschuldenquote Deutschlands von 2002 bis 2015.jpg 1,076 × 271; 127 KB
-
 IIA Spaghetti Bowl.png 596 × 352; 284 KB
-
 IIA Trends.JPG 503 × 267; 33 KB
-
 Informationsparadoxon.png 500 × 500; 6 KB
-
 INSTITUCIONES Y MERCADOS FINANCIEROS I.pdf 2,000 × 1,125, 30 pages; 1.33 MB
-
 Investcorp FirstBoardOfDirectors.png 573 × 445; 384 KB
-
 JLSanfuentes.jpg 200 × 260; 62 KB
-
 JohnBollinger.jpg 343 × 336; 26 KB
-
 Laurent Calvet en 2023.jpg 491 × 658; 171 KB
-
 Macquarie Bank.jpg 1,795 × 1,806; 424 KB
-

-
 MJYrarrazavalL.jpg 200 × 260; 52 KB
-
 Moelis and Company logo.png 384 × 39; 3 KB
-
 Naked short selling.svg 216 × 205; 12 KB
-
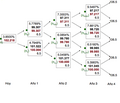 OAS valuation tree (es).png 640 × 550; 45 KB
-
 Offshore financial centers.png 1,357 × 628; 47 KB
-
 Pair tool.JPG 922 × 485; 94 KB
-
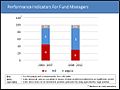 Performance Indicators for Fund Managers.JPG 1,007 × 757; 80 KB
-
 PIN Model 1996.JPG 818 × 1,131; 38 KB
-
 PMC logo small.jpg 490 × 375; 73 KB
-
 PredeterminedOverheadRate.jpg 426 × 47; 23 KB
-
 PSDBPSVerDiff.JPG 1,199 × 608; 132 KB
-
 Reification Coventry Building Society.jpg 1,200 × 1,600; 313 KB
-
 Reporänta månaktligt genomsnitt 1994 till 2010.JPG 511 × 292; 36 KB
-
 Rez UT.JPG 170 × 181; 24 KB
-
 RKabir July2010.jpg 739 × 1,024; 300 KB
-
 ROAwzór.PNG 568 × 100; 6 KB
-
 ROEwzór.PNG 571 × 100; 5 KB
-
 ROSwzór.PNG 685 × 100; 6 KB
-
 Sample 2009 Director Compensation Table.jpg 1,265 × 661; 292 KB
-
 SARIO-EN-velke.png 1,853 × 772; 57 KB
-
 Scatter.$1t.gdp.jpg 1,114 × 532; 29 KB
-
 Short selling.svg 285 × 238; 18 KB
-
 SIEPA logo.jpg 200 × 200; 21 KB
-
 Slippage Example on the SPY ETF.png 679 × 680; 19 KB
-
 SRS Orga-Angebot.jpg 255 × 234; 19 KB
-
 State price vector.png 378 × 313; 37 KB
-
 Stockpricesimulation.jpg 1,593 × 1,206; 117 KB
-
 Stocks to use ag Indicators market 1977 2007.png 502 × 330; 39 KB
-
 Strategy Analysis Graph.jpg 771 × 429; 38 KB
-
 Structural & Cyclical Components of Budget, jjron, 21.05.2013.gif 728 × 480; 19 KB
-

-
 Topology of US market before and after transition.jpg 388 × 161; 30 KB
-
 TradeOff.png 384 × 279; 15 KB
-
 Trends ISDS.png 544 × 309; 14 KB
-
 Triangular-arbitrage.svg 496 × 388; 57 KB
-
 U.S. Stock market capital distribution curves 1929-2009.pdf 1,200 × 900; 312 KB
-
 U.S. Stock market entropy 1980-2012.pdf 1,200 × 900; 97 KB
-
 UK house prices adjusted for inflation.png 758 × 503; 4 KB
-
 Uncovered-interest-arbitrage.svg 465 × 227; 165 KB
-
 Uncovered-interest-rate-parity.svg 465 × 227; 162 KB
-
 Undercover Boss logo.jpg 476 × 225; 11 KB
-
 VGL logo.jpg 326 × 139; 9 KB
-
 Wiki spread slippoint.jpg 441 × 259; 50 KB
-
 Wooden slick drives movies.png 64 × 64; 6 KB
-
 Évolution action barclays 2008.png 995 × 521; 25 KB


.png)


.png)


.png)