Category:French-language SVG charts
Jump to navigation
Jump to search
Subcategories
This category has only the following subcategory.
*
Media in category "French-language SVG charts"
The following 200 files are in this category, out of 203 total.
(previous page) (next page)-
10 pays emissions C02 2006.svg 656 × 522; 18 KB
-
100 m. men WR.svg 1,636 × 970; 446 KB
-
100m men WR.svg 1,680 × 1,034; 18 KB
-
1929 wall street crash graph.svg 800 × 400; 45 KB
-
200m men WR.svg 2,040 × 1,304; 27 KB
-
2011 01 Europe Browser share-fr.svg 862 × 930; 10 KB
-
2011 Drug Harms Rankings fr.svg 790 × 570; 51 KB
-
Activation energy fr.svg 465 × 358; 20 KB
-
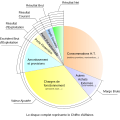
Aide conventionnelle.svg 464 × 391; 7 KB
-
AidsstatUSA.svg 800 × 600; 15 KB
-
Air Canada Flight 797 seat injury chart-fr.svg 1,456 × 353; 74 KB
-
Airolo climat WL.svg 717 × 476; 129 KB
-
Airolo climat.svg 714 × 482; 133 KB
-
Alaska RaceComposition2005 PieChart.svg 1,050 × 800; 49 KB
-
Alcala de Henares (Spain)-demography-fr.svg 700 × 493; 39 KB
-
Alcala de Henares population growth.svg 700 × 493; 37 KB
-
All.svg 512 × 410; 26 KB
-
Arabic numerals-fr.svg 397 × 142; 31 KB
-
Aude hydrology-fr.svg 530 × 343; 30 KB
-
Authie débit.svg 478 × 485; 90 KB
-
Authie hydrology-fr.svg 1,761 × 1,450; 19 KB
-
Berne climat WL.svg 715 × 481; 123 KB
-
Berne climat.svg 712 × 478; 135 KB
-
Bethune hydrology-fr.svg 1,078 × 600; 34 KB
-
Bilan circonstanciel accident.svg 525 × 438; 33 KB
-
BMI fr.svg 945 × 525; 30 KB
-
BMI grid fr.svg 945 × 525; 34 KB
-
Boucle notaire janv010.svg 512 × 384; 30 KB
-
Bresle hydrology-fr.svg 954 × 507; 291 KB
-
Budget MEDIA 2001-2006.svg 882 × 753; 79 KB
-
Budget MEDIA I 1991-1995.svg 460 × 364; 23 KB
-
Budget MEDIA II 1996-2000.svg 460 × 364; 29 KB
-
Cailly hydrology-fr.svg 958 × 660; 30 KB
-
Calcul index glycémique triangle.svg 496 × 372; 10 KB
-
Changing composition molten salt reactor-fr.svg 512 × 329; 58 KB
-
Chinapop.svg 800 × 600; 16 KB
-
Climat-boundiali.svg 469 × 469; 70 KB
-
Cmbr.svg 600 × 480; 18 KB
-
Commandes et livraisons du Boeing 767 depuis 1978.svg 750 × 450; 15 KB
-
Commandes par constructeur (1989-2014).svg 600 × 400; 25 KB
-
Comparaison RSA et IPC (base 100, janv. 1990).svg 700 × 400; 21 KB
-
Consensus nouveau et ancien.svg 600 × 900; 45 KB
-
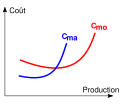
Cost curves 05-fr.svg 1,000 × 450; 11 KB
-
Cost curves 07-fr.svg 500 × 450; 7 KB
-
Cost curves 08-fr.svg 500 × 450; 7 KB
-
Cost curves 09-fr.svg 500 × 450; 13 KB
-
Courbe sensitométrique.svg 756 × 278; 13 KB
-
Coutfixe.svg 512 × 724; 4 KB
-
Croissance du PIB de la France et du G7 depuis 1980.svg 600 × 400; 21 KB
-
Daewoo Matiz F8C motor curves and functional zones-fr.svg 1,150 × 950; 41 KB
-
Daewoo Matiz F8C power, consumption and torque-fr.svg 1,150 × 950; 28 KB
-
Davos climat-WL.svg 733 × 553; 110 KB
-
Davos climat.svg 733 × 553; 115 KB
-
Democratic Republic of the Congo GDP evolution-fr.svg 730 × 504; 313 KB
-
Dette publique par secteur (1978-2016).svg 700 × 405; 65 KB
-
Diagramme p-v évolutions infiniment lentes gaz parfait.svg 1,231 × 1,222; 13 KB
-
Diagrammes p-v évolutions rapides d'un gaz parfait.svg 1,340 × 2,409; 18 KB
-
Distribution of Wealth in France.svg 800 × 600; 24 KB
-
DMPie 2013 fr.svg 341 × 341; 10 KB
-
Durdent hydrology-fr.svg 851 × 563; 31 KB
-
EcartsTempSurface2013.svg 512 × 384; 18 KB
-
EcartsTempSurface2014.svg 512 × 384; 19 KB
-
EcartsTempSurface2015.svg 512 × 341; 23 KB
-
Electricity Production in Japan.svg 750 × 560; 28 KB
-
Elemental abundances - fr.svg 800 × 620; 8 KB
-
Employment insurance beneficiaries.svg 600 × 400; 47 KB
-
Encours de dette publique au sens de Maastricht (France).svg 800 × 400; 49 KB
-
Enseignement supérieur français avant 2009.svg 597 × 440; 9 KB
-
Eqmonopole.svg 499 × 351; 10 KB
-
Florida demographie 1830-2000-fr.svg 1,165 × 594; 64 KB
-
Florida tourism 1933-2005.svg 482 × 369; 62 KB
-
French coal consumption by sector-fr.svg 1,055 × 572; 34 KB
-
Frontières de libre echange.svg 534 × 405; 7 KB
-
Galactic Rotation-fr.svg 250 × 150; 8 KB
-
Galaxy color-magnitude diagram-fr.svg 671 × 609; 8 KB
-
GDP of China in RMB.svg 750 × 620; 19 KB
-
Genève climat.svg 469 × 469; 66 KB
-
Global Wind Power Cumulative Capacity.svg 900 × 750; 14 KB
-
Grain Sorption Desorption graph-fr.svg 1,994 × 1,331; 17 KB
-
Graph avancement.png 372 × 252; 4 KB
-
Gravitational Acceleration Earth-fr.svg 512 × 337; 9 KB
-
Heating type CH all cantons 2021 FR.svg 990 × 720; 58 KB
-
Heating type CH Canton AG 2021 FR.svg 1,080 × 720; 12 KB
-
Heating type CH Canton AI 2021 FR.svg 1,080 × 720; 12 KB
-
Heating type CH Canton AR 2021 FR.svg 1,080 × 720; 12 KB
-
Heating type CH Canton BE 2021 FR.svg 1,080 × 720; 12 KB
-
Heating type CH Canton BL 2021 FR.svg 1,080 × 720; 12 KB
-
Heating type CH Canton BS 2021 FR.svg 1,080 × 720; 12 KB
-
Heating type CH Canton FR 2021 FR.svg 1,080 × 720; 12 KB
-
Heating type CH Canton GE 2021 FR.svg 1,080 × 720; 12 KB
-
Heating type CH Canton GL 2021 FR.svg 1,080 × 720; 12 KB
-
Heating type CH Canton GR 2021 FR.svg 1,080 × 720; 12 KB
-
Heating type CH Canton JU 2021 FR.svg 1,080 × 720; 12 KB
-
Heating type CH Canton LU 2021 FR.svg 1,080 × 720; 12 KB
-
Heating type CH Canton NE 2021 FR.svg 1,080 × 720; 12 KB
-
Heating type CH Canton NW 2021 FR.svg 1,080 × 720; 12 KB
-
Heating type CH Canton OW 2021 FR.svg 1,080 × 720; 12 KB
-
Heating type CH Canton SG 2021 FR.svg 1,080 × 720; 12 KB
-
Heating type CH Canton SH 2021 FR.svg 1,080 × 720; 12 KB
-
Heating type CH Canton SO 2021 FR.svg 1,080 × 720; 12 KB
-
Heating type CH Canton SZ 2021 FR.svg 1,080 × 720; 12 KB
-
Heating type CH Canton TG 2021 FR.svg 1,080 × 720; 12 KB
-
Heating type CH Canton TI 2021 FR.svg 1,080 × 720; 12 KB
-
Heating type CH Canton UR 2021 FR.svg 1,080 × 720; 12 KB
-
Heating type CH Canton VD 2021 FR.svg 1,080 × 720; 12 KB
-
Heating type CH Canton VS 2021 FR.svg 1,080 × 720; 12 KB
-
Heating type CH Canton ZG 2021 FR.svg 1,080 × 720; 12 KB
-
Heating type CH Canton ZH 2021 FR.svg 1,080 × 720; 12 KB
-
Hedge funds and tax haven-fr.svg 654 × 632; 27 KB
-
Herring Gull population in France 1965-1998-fr.svg 1,100 × 1,100; 30 KB
-
Intentions de vote au Québec (1988-1993, fédéral).svg 576 × 384; 69 KB
-
Intentions de vote au Québec (2000-2004, fédéral).svg 540 × 360; 66 KB
-
Intentions de vote au Québec (2008-2011, fédéral).svg 540 × 360; 78 KB
-
Intentions de vote au Québec (Campagne de 1993, fédéral).svg 576 × 384; 39 KB
-
Intentions de vote au Québec (Campagne de 2011, fédéral).svg 540 × 360; 58 KB
-
Irkutsk climate diagram-fr.svg 469 × 469; 69 KB
-
Irtych hydrology (Tobolsk)-fr.svg 1,000 × 682; 20 KB
-
Kaziranga-census-results-fr.svg 1,000 × 775; 20 KB
-
Kilimanjaro climate diagram-fr.svg 1,000 × 850; 97 KB
-
Korhogo demographie.svg 1,730 × 1,584; 17 KB
-
Liste des plus grands ports à conteneurs.svg 680 × 460; 27 KB
-
Lithium world production.svg 750 × 580; 12 KB
-
Mauna Loa CO2 monthly mean concentration FR.svg 708 × 708; 439 KB
-
Mauvaises herbes résistantes aux herbicides auxiniques.svg 2,325 × 840; 52 KB
-
Montant de la contribution santé au Québec.svg 600 × 400; 16 KB
-
Ménages allocataires (Assistance sociale, Québec).svg 600 × 400; 64 KB
-
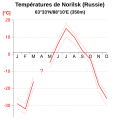
Norilsk climate diagram-fr.svg 469 × 469; 66 KB
-
Norvege Hubbert.svg 512 × 387; 24 KB
-
Oust hydrology-fr.svg 869 × 595; 36 KB
-
Parlement palestinien après les élections de janvier 2005.svg 1,244 × 935; 11 KB
-
Parlement palestinien après les élections de janvier 2006.svg 800 × 600; 9 KB
-
Part d'audience mensuelle de France 2.svg 500 × 340; 43 KB
-
Part d'audience mensuelle de TF1.svg 600 × 400; 44 KB
-
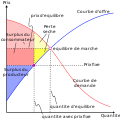
Perteseche.svg 350 × 350; 12 KB
-
PIB Nouvelle Calédonie 2020.svg 1,500 × 1,000; 9 KB
-
Point d'indice en France.svg 600 × 460; 14 KB
-
Political chart.svg 543 × 590; 14 KB
-
Q de Tobin.svg 439 × 284; 31 KB
-
Quantité d'ammoniac produite mondialement 1946-2007.svg 529 × 396; 43 KB
-
Quantité d'azote de 1910 à 2000 (non Haber-Bosch).svg 703 × 445; 84 KB
-
Rapport de force au 1er tour des élections présidentielle.svg 680 × 550; 12 KB
-
Rareearth production-fr.svg 447 × 268; 27 KB
-
Recettes de l'impôt sur le tabac au Québec.svg 600 × 400; 38 KB
-
Repartition population Helsinki Lauttasaari (2006)-2.svg 1,807 × 1,518; 25 KB
-
Repartition population Helsinki Lauttasaari (2006).svg 1,079 × 836; 17 KB
-
Resultat Lightcraft 1-1.svg 194 × 157; 3 KB
-
Retrait maximal permis pour le RAP.svg 600 × 400; 28 KB
-
Rissa tridactyla population in France 1968-2000-fr.svg 1,100 × 800; 29 KB
-
Roadmap to Unicode BMP multilingual.svg 900 × 550; 91 KB
-
Roadmap to Unicode SIP multilingual.svg 940 × 554; 46 KB
-
Roadmap to Unicode SMP multilingual.svg 935 × 550; 85 KB
-
Roadmap to Unicode SSP multilingual.svg 940 × 554; 21 KB
-
Roadmap to Unicode TIP multilingual.svg 940 × 554; 45 KB
-
Roland garros merchandising 1994-2000-fr.svg 480 × 371; 65 KB
-
Saint-Petersburg climate diagram-fr.svg 469 × 469; 74 KB
-
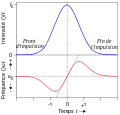
Self-phase-modulation-fr.svg 445 × 428; 24 KB
-
SIG.svg 782 × 776; 15 KB
-
SMIC horaire brut depuis 1995.svg 600 × 400; 21 KB
-
SMIC horaire depuis 1980.svg 600 × 400; 39 KB
-
Solarcellige-fr.svg 964 × 799; 39 KB
-
Solde budgétaire du gouvernement fédéral canadien.svg 600 × 480; 51 KB
-
Solde du régime général de la Sécurité Sociale.svg 600 × 420; 8 KB
-
Sondages depuis l'élection générale de 2014.svg 800 × 440; 65 KB
-
Structure du revenu et pression fiscale des ménages.svg 505 × 475; 11 KB
-
Sunspot Numbers-fr.svg 1,000 × 425; 64 KB
-
Taux d'intérêt à 10 ans des emprunts d'état américains.svg 704 × 445; 80 KB
-
Taux de chômage aux États-Unis dans les années 1990.svg 485 × 290; 12 KB
-
Taux standard de TVA dans les pays européens.svg 810 × 480; 17 KB
-
Texas demographie 1860-2000.svg 2,707 × 1,369; 17 KB
-
Top Five US Solar States.svg 750 × 560; 14 KB
-
Transition metal oxidation states.svg 800 × 300; 30 KB
-
Uluru climate diagram-fr.svg 469 × 469; 61 KB
-
Unemployment in Germany - 1928-1935-fr.svg 976 × 463; 46 KB
-
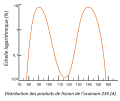
Uranium-235 fission product-fr.svg 508 × 424; 201 KB
-
US and USSR nuclear stockpiles-fr.svg 876 × 705; 46 KB
-
US incarceration timeline-clean.svg 693 × 464; 11 KB
-
US male arrests for liquor laws by age.svg 800 × 600; 10 KB
-
USpop-1950.svg 800 × 600; 23 KB
-
Variation indice insee mid 2011.svg 512 × 412; 53 KB
-
Vehicles emissions standards in EU, USA and Japan-fr.svg 1,000 × 800; 28 KB
-
Vladivostok climate diagram-fr.svg 469 × 469; 67 KB
-
Volgograd climate diagram-fr.svg 469 × 469; 60 KB
-
Wikimedia Foundation financial development multilanguage.svg 512 × 941; 10 KB
-
Wp08 wars.svg 300 × 180; 46 KB
-
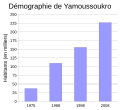
Yamoussoukro demographie.svg 1,730 × 1,584; 17 KB
-
Échanges commerciaux de la France depuis janvier 1975.svg 600 × 400; 39 KB
-
Échanges commerciaux du Canada depuis janvier 1988.svg 600 × 400; 163 KB
-
Éditions wp fr global.svg 1,024 × 768; 97 KB


