Category:Genes
Jump to navigation
Jump to search
basic physical and functional unit of heredity  | |||||
| Upload media | |||||
| Spoken text audio | |||||
|---|---|---|---|---|---|
| Subclass of |
| ||||
| Part of |
| ||||
| Different from | |||||
| |||||
Subcategories
This category has the following 21 subcategories, out of 21 total.
A
- Artificial gene fusion (5 F)
C
- Candidate gene (11 F)
- CD48 antigen (7 F)
- Chromosome mapping (30 F)
G
- GAP-43 protein (7 F)
- Gene classes (12 F)
- Gene discovery (10 F)
- Gene dosage (14 F)
- Gene duplication (32 F)
- Gene library (11 F)
N
- Number of genes (11 F)
P
S
- Selfish gene (6 F)
T
- Thioredoxin reductase 1 (5 F)
- TNF-alpha-converting enzyme (7 F)
Media in category "Genes"
The following 200 files are in this category, out of 278 total.
(previous page) (next page)-
 16S PCR DGGE.jpg 499 × 273; 27 KB
-
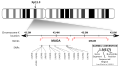
 2q37.3.png 1,024 × 197; 24 KB
-
 3decision 3D Viewer.svg 512 × 318; 928 KB
-
 4XHT asyr r 250.jpg 250 × 250; 20 KB
-
 50 50 chance.jpg 541 × 346; 29 KB
-
 A1BGgeneneighb.fcgi.png 485 × 75; 1,007 bytes
-
 A1BGprod.fcgi.png 540 × 68; 1 KB
-
 AAMDC.png 2,100 × 2,100; 1.8 MB
-
 ABCC11 genmap 01.svg 892 × 542; 80 KB
-
 Adenylylated Unadenylylated GS.PNG 457 × 478; 26 KB
-
 AIMP2.png 2,800 × 2,800; 6.04 MB
-
 Alleles on gene-es.png 433 × 401; 155 KB
-
 Alleles on gene.jpg 647 × 600; 71 KB
-
 Alteracions descrites al gen NR3C1.jpg 800 × 600; 36 KB
-
 AMY1cDNA.png 651 × 640; 57 KB
-
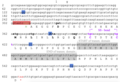
 Annotated Conceptual Translation of C19orf18.png 808 × 545; 115 KB
-
 Another KIAA0090 Conceptual Translation.jpg 741 × 810; 137 KB
-
 Antigenic Drift of the Flu Virus (5102830852).jpg 500 × 777; 194 KB
-
 APTX .png 2,100 × 2,100; 1.87 MB
-
 Arabinose operon chemical reactions.svg 1,594 × 338; 113 KB
-
 ATM 00000.png 2,100 × 2,100; 4.18 MB
-
 ATR .png 2,800 × 2,100; 4.62 MB
-
 Bcr-abl fusion gene.jpg 399 × 248; 16 KB
-
 BIOI Protein Representation.png 794 × 386; 81 KB
-
 Bloom syndrome protein.png 2,100 × 2,100; 793 KB
-
 BMP4 Signal Transduction Pathways.gif 720 × 540; 28 KB
-
 BotrydialGeneCluster.png 699 × 97; 27 KB
-
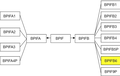
 BPIFfamily-BPIF-A1.png 952 × 599; 73 KB
-
 BPIFfamily-BPIF-A2.png 952 × 599; 74 KB
-
 BPIFfamily-BPIF-A3.png 952 × 599; 74 KB
-
 BPIFfamily-BPIF-A4P.png 952 × 599; 73 KB
-
 BPIFfamily-BPIFB1.png 952 × 599; 75 KB
-
 BPIFfamily-BPIFB2.png 952 × 599; 75 KB
-
 BPIFfamily-BPIFB3.png 952 × 599; 75 KB
-
 BPIFfamily-BPIFB4.png 952 × 599; 75 KB
-
 BPIFfamily-BPIFB5P.png 952 × 599; 75 KB
-
 BPIFfamily-BPIFB6.png 952 × 599; 74 KB
-
 BPIFfamily-BPIFB9P.png 952 × 599; 74 KB
-
 Brain Atlas.jpg 626 × 437; 49 KB
-
 BRCA Genes.svg 512 × 288; 48 KB
-
 BRCC3.png 2,500 × 2,100; 1.89 MB
-
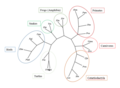
 C14 unrooted.png 2,004 × 1,547; 896 KB
-
 C1orf112 Location.png 1,062 × 214; 23 KB
-
 C1orf112Predicted3DStructure.png 984 × 750; 418 KB
-
 C20or202 transcription binding factor sites.png 1,122 × 1,238; 473 KB
-
 C20orf202 expression levels.png 2,392 × 538; 609 KB
-
 C20orf202 promoter.jpg 4,627 × 13,136; 9.13 MB
-
 C20orf202 structure.png 672 × 662; 105 KB
-
 C21orf62 Gene Evolution in Humans.png 928 × 524; 78 KB
-
 C2orf72 locus, 2q37.1.png 116 × 894; 20 KB
-
 C2orf72 Orthologs List.png 807 × 616; 305 KB
-
 C45 unrooted.png 1,503 × 1,002; 241 KB
-
 C4orf50 Gene Locus.png 1,602 × 202; 265 KB
-
 Cancer pharmacogenomics.png 1,206 × 804; 131 KB
-
 Caspase-motif-alignment.png 1,070 × 175; 27 KB
-
 CBlast 72-272 asparagines.png 326 × 452; 118 KB
-
 CCDC113 coiled-coil domain containing 113 - Homo sapiens (human).png 485 × 51; 867 bytes
-
 CCDC132 cartoon.png 818 × 82; 7 KB
-
 CCDC74A Diagram.png 1,296 × 200; 24 KB
-
 CDK1 .png 2,100 × 2,100; 2.93 MB
-
 CGDB CGDef.png 775 × 200; 30 KB
-
 CGDef 1.png 693 × 179; 28 KB
-
 Commonly used cell lineage marking strategies..jpg 400 × 516; 104 KB
-
 Compact Gene Diagram of C2orf70.png 1,430 × 478; 81 KB
-
 Comparaison protéines HB chez insectes.png 1,108 × 526; 24 KB
-
 Complete network.jpg 1,391 × 867; 98 KB
-
 Conceptual Translation 1.jpg 642 × 153; 20 KB
-
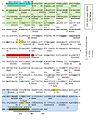
 Conceptual Translation of SMIM14 protein.png 1,616 × 1,102; 192 KB
-
 Conceptual Translation.jpg 683 × 847; 132 KB
-
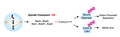
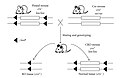 Conditional Knockout Mouse.jpg 427 × 277; 53 KB
-
 Cromosoma 5 amb senyalització al locus 5q31.3.png 1,094 × 140; 23 KB
-
 De-Gene.png 376 × 301; 49 KB
-
 DEPDC1B - Large-scale analysis of the mouse transcriptome.png 2,023 × 340; 24 KB
-
 DEPDC1B Conceptual Visualization.png 800 × 602; 12 KB
-
 DEPDC1B confirmed spice variants.png 1,067 × 142; 21 KB
-
 DEPDC1B Gene Locus - Chromosome 5.png 720 × 90; 1 KB
-
 Diagram of MEGF8 Splice Variants.png 1,119 × 403; 58 KB
-
-
 Dimer Mad1 Mad2.png 800 × 600; 222 KB
-
 DNA Diagram.png 336 × 192; 29 KB
-
 Domain carton.png 1,027 × 221; 56 KB
-
 DQ Illustration.PNG 274 × 203; 7 KB
-
 EFEMP2 protein.png 2,100 × 2,100; 1.97 MB
-
 EIF2AK2 protein.png 2,100 × 2,100; 1.04 MB
-

-
 ERCC6 protein.png 2,500 × 1,050; 1.26 MB
-
 EST Profiles.jpg 914 × 862; 151 KB
-
 Etv6 tm1a(KOMP)Wtsi.jpg 1,190 × 153; 95 KB
-
 Evolution fate duplicate genes - vector - cs.svg 576 × 360; 155 KB
-
 Evolution fate duplicate genes - vector.svg 576 × 360; 144 KB
-
 Evolution of Human GRAMD1B.jpg 844 × 557; 61 KB
-
 Evolution of Xist gene.tif 1,743 × 672; 107 KB
-
 Evolution of XIST-ru.tif 1,829 × 713; 3.76 MB
-
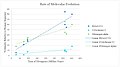
 Evolutionary History Graph.png 1,222 × 710; 40 KB
-
 Evolutionary History PRR30.png 1,155 × 759; 89 KB
-
 Evolutiongraph.png 897 × 522; 31 KB
-
 EvolutionOfDuplicateGenes.png 1,326 × 677; 28 KB
-
 Exon variants for POTEB.jpg 1,282 × 234; 40 KB
-
 Expression data.png 370 × 772; 10 KB
-
 F4.large.jpg 1,280 × 756; 82 KB
-
 FAM71E2 gene.png 1,488 × 261; 41 KB
-
 FAM71E2 image.gif 485 × 51; 798 bytes
-
 Figure 3 (8143602909).png 806 × 631; 218 KB
-
 Figure 4 (6796062698).png 606 × 370; 267 KB
-
 Figure 7 (7558900506).png 888 × 817; 990 KB
-
 Figure1(Yao).gif 651 × 939; 21 KB
-
 Figure2(Yao).gif 666 × 298; 12 KB
-
 Figure3(Yao).gif 528 × 201; 7 KB
-
 FITM2 Protein Structure.png 908 × 590; 39 KB
-
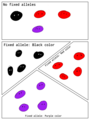 Fixed alleles illustration.png 768 × 1,024; 98 KB
-
 Flu Vaccine- Reassortment (5102830876).jpg 500 × 854; 369 KB
-
 Fmicb-12-679245-g004.jpg 2,032 × 598; 131 KB
-
 Foco de adhesión esquema 2.jpg 7,874 × 6,687; 7.1 MB
-
 Future Developmental Structures of the Embryonic Telencephalon.svg 748 × 418; 230 KB
-
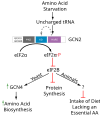 Gcn2 function.svg 1,481 × 1,772; 33 KB
-
 Gen CDK4.svg 1,000 × 130; 7 KB
-
 Gen IRAK4.jpeg 345 × 193; 13 KB
-
 Gen2.png 803 × 252; 8 KB
-
 Gen2.svg 741 × 229; 52 KB
-
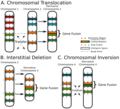 Gene Fusion Types.png 576 × 525; 86 KB
-
 Gene Intron Exon es.svg 677 × 565; 46 KB
-
 Gene Intron Exon nb.svg 677 × 565; 46 KB
-
 Gene name errors are widespread in the scientific literature.pdf 1,239 × 1,645, 3 pages; 366 KB
-
 Gene name normalization.jpg 600 × 737; 38 KB
-
 Gene neighborhood for C11orf54.png 519 × 101; 11 KB
-
 Gene Prediction.png 1,408 × 1,056; 64 KB
-
 Gene promoters according to T1D, IDM and T2D.png 2,205 × 1,469; 790 KB
-
 Gene structure (13080962024).jpg 842 × 318; 18 KB
-
 Gene structure de.svg 1,196 × 328; 12 KB
-
 Gene structure eukaryote 2 unannotated.svg 1,190 × 640; 106 KB
-
 Gene structure prokaryote 2 unannotated.svg 1,190 × 586; 99 KB
-
 Gene structure.gif 494 × 105; 4 KB
-
 Gene structure.svg 480 × 75; 11 KB
-
 Gene therapyB.jpg 142 × 142; 26 KB
-
 Gene time line draft.png 1,012 × 567; 46 KB
-
 Gene-ar.png 377 × 301; 54 KB
-
 Gene.png 376 × 301; 37 KB
-
 Gene2-plain-norsk.svg 1,395 × 1,182; 27 KB
-
 Genelocation2.png 722 × 92; 8 KB
-
 Genes and base pairs on chromosomes mk.svg 592 × 298; 184 KB
-
 Genes and base pairs on chromosomes.svg 592 × 298; 32 KB
-
 Genes and bases on chromosomes.png 762 × 270; 12 KB
-

-
 Genomic view of PRR29.png 720 × 90; 1 KB
-
 Glutamine synthetase II.jpg 1,128 × 475; 96 KB
-
 Glutamine synthetase.jpg 1,482 × 231; 151 KB
-
 GPS2 protein.png 1,050 × 2,500; 1.32 MB
-
 GRP .png 2,100 × 2,100; 736 KB
-
 GSK3B.png 454 × 388; 151 KB
-
 Healthspan, parental lifespan, and longevity are highly genetically correlated.webp 1,998 × 1,269; 87 KB
-
 Hgh hpl.jpg 3,885 × 2,687; 2.52 MB
-
 High conservation.jpg 721 × 225; 89 KB
-
 HIPK2 .png 2,100 × 2,100; 2.31 MB
-
 HMGA1.png 2,100 × 2,100; 2.39 MB
-
 Hox gene expression in bones from tetrapod limbs.tif 1,335 × 760; 385 KB
-
 HSPA9.png 2,100 × 2,100; 1.86 MB
-
 HTR2C .png 2,600 × 1,462; 953 KB
-
 Human proteins - Conceptual translation of TMEM126B.png 450 × 503; 60 KB
-
Hy-Գեն (Gene).ogg 2 min 34 s; 5.17 MB
-
 ING1 .png 2,100 × 2,100; 2.43 MB
-
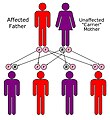 Inheritance 01.jpg 2,000 × 2,176; 394 KB
-
 Inheritance.jpg 2,000 × 2,176; 390 KB
-
 Interferon lambda genes.jpg 1,137 × 490; 56 KB
-
 Iodothyronine deiodinase.jpg 720 × 540; 43 KB
-
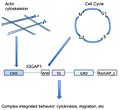 IQGAP1 pic2.jpg 432 × 397; 30 KB
-
 IQGAP1.jpg 486 × 112; 15 KB
-
 KIAA1551Tree.png 829 × 605; 69 KB
-
 Kiaa1797 DUF pic.PNG 804 × 60; 3 KB
-
 Kiaa1797 expression pic.PNG 729 × 292; 97 KB
-
 Kiaa1797 Gene hood.PNG 620 × 91; 53 KB
-
 Kit expression in hematopoietic cells.JPG 839 × 577; 42 KB
-
 L1CAM gene.png 630 × 118; 8 KB
-
 Lac complementation.png 926 × 800; 74 KB
-
 Lactase Processing.png 1,440 × 361; 55 KB
-
 Lasso-peptide-biosynthesis.png 1,651 × 2,229; 111 KB
-
 Liao, WW., Asri, M., Ebler, J. et al. (2023) Fig14.webp 2,125 × 819; 100 KB
-
 LIG1 gene showing important domains.gif 383 × 106; 4 KB
-
 Local seq alignment.JPG 901 × 190; 21 KB
-
 Location of C4orf54 on human chromosome 4.png 664 × 84; 27 KB
-
 LRRC23 RADAR Internal Repeats.png 553 × 291; 67 KB
-
 MAD1 function in SAC.jpg 759 × 297; 25 KB
-
 Mad2exchange.png 480 × 247; 65 KB
-
 Mad2figure.jpg 835 × 440; 68 KB
-
 MAOA Gene with ChrX Ideogram.svg 1,280 × 715; 42 KB
-
 MCC on.png 599 × 185; 42 KB
-
 Mdia1 domains.jpg 320 × 70; 23 KB
-
 Mhc geny.svg 680 × 280; 137 KB
-
 Migración SDC4.jpg 879 × 520; 102 KB
-
 Mir-155 gene.pdf 1,650 × 1,275; 221 KB
-
 MLH1 for Wiki 12192018V7.png 1,151 × 1,022; 235 KB
-
 MLPA (completa).png 748 × 906; 53 KB
-
 Modèle gènes ABCDE.png 853 × 521; 16 KB
-
 MolecularEvolutionKIAA1551.jpg 849 × 473; 47 KB
-
 Mousehoxgenes.png 652 × 700; 45 KB
-
 MSX1.jpg 418 × 583; 80 KB
-
 Multiple sequence alignment.JPG 894 × 725; 170 KB
-
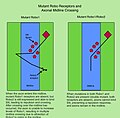 Mutant Robo Receptors and Axonal Midline Crossing.jpg 974 × 959; 256 KB
-
 MYBL2 in cell cycle.png 588 × 348; 17 KB
-
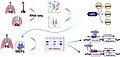
 Nasopharyngeal and oropharyngeal Swabs in VTM for SARS-CoV-2 Detection.jpg 4,000 × 2,250; 2.41 MB
-
 NBPF10 neighborhood.PNG 823 × 283; 32 KB


.jpg)


.png)
.png)
.png)
.gif)
.gif)


.jpg)


.jpg)


.png)


.png)
Wtsi.jpg)
.gif)
.jpg)
_Fig14.webp)