Category:Graphics from the UNESCO Science Report, towards 2030, Chapter 8, Brazil
Jump to navigation
Jump to search
Media in category "Graphics from the UNESCO Science Report, towards 2030, Chapter 8, Brazil"
The following 16 files are in this category, out of 16 total.
-
 Brazilian business sector’s contribution to GERD as a share of GDP, 2012.svg 496 × 333; 1.31 MB
-
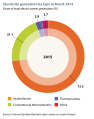 Electricity generation by type in Brazil, 2015.svg 236 × 300; 3.63 MB
-
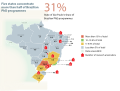 Five states concentrate more than half of Brazilian PhD programmes.svg 418 × 318; 18.46 MB
-
 FTE researchers in Brazil by sector, 2001 and 2011.svg 490 × 326; 867 KB
-
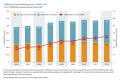
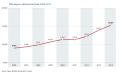
 GDP per capita and GDP growth rate for Brazil, 2003–2013.svg 497 × 271; 4.67 MB
-
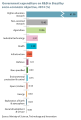
 GERD in Brazil by funding sector, 2004–2012.svg 496 × 335; 1.31 MB
-
-
 Growth in Brazilian publications has slowed since 2008.svg 512 × 316; 1.3 MB
-
 Life science dominate Brazilian publications.svg 512 × 280; 1.3 MB
-
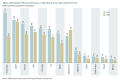
 PhD degrees obtained in Brazil, 2005–2013.svg 492 × 306; 1.77 MB
-

-

-
-
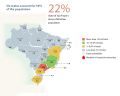 Six states in Brazil account for 59 percent of the population.svg 427 × 340; 13.39 MB
-
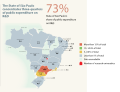
 São Paulo dominates higher education spending on R&D.svg 400 × 371; 14.03 MB
-