Category:Graphics of famine
Jump to navigation
Jump to search
Media in category "Graphics of famine"
The following 20 files are in this category, out of 20 total.
-
 Comparing GHI Scores by Region 1990 - 2011.jpg 2,250 × 1,299; 1,005 KB
-
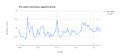 Courbe du prix du setier de froment à Paris 1700-1788.png 970 × 452; 23 KB
-
 Famine-victims-since-1860s March18 12502.png 12,502 × 8,752; 1.77 MB
-
 FamineGrèce1941-1944.png 1,252 × 1,704; 455 KB
-
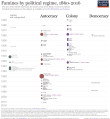 Famines by political regime.png 3,960 × 4,300; 428 KB
-
 Famines-and-GDP 2324.png 2,324 × 1,511; 208 KB
-
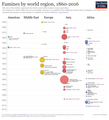 Famines-by-continent-and-ME-01 1839.png 1,839 × 2,022; 209 KB
-
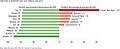
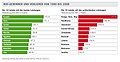
 GHI winners and losers from 1990 to 2008.jpg 2,133 × 1,040; 638 KB
-
 Global famines history.jpg 2,969 × 1,683; 507 KB
-
 Global Hunger Index, 1990-2008 (all countries in comparison).jpg 2,204 × 3,093; 1.79 MB
-
 GlobalTrade wheat coarse grain soy 2008 usda.png 431 × 327; 5 KB
-
 Grafico variazioni regionali GHI 2010.jpg 713 × 363; 190 KB
-
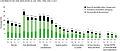 Grafico variazioni regionali GHI.jpg 2,529 × 1,078; 391 KB
-
 History of Global Famines.svg 512 × 362; 447 KB
-
 Prognose zur Welternährung für 2025.PNG 828 × 582; 63 KB
-
 The global hunger index is calculated as follows.jpg 1,064 × 672; 235 KB
-
 Verfügbare landwirtschaftliche Nutzfläche pro Kopf.PNG 856 × 529; 46 KB
-
 Vincenti e perdenti GHI 2011.jpg 2,233 × 917; 357 KB
-
 Was ist der WH-Index.jpg 9,494 × 2,338; 221 KB
-
 WHI Gewinner und Verlierer.jpg 2,151 × 1,108; 662 KB


.jpg)


