Category:Graphics produced by the International Energy Agency for Energy Technology Perspectives
Jump to navigation
Jump to search
Media in category "Graphics produced by the International Energy Agency for Energy Technology Perspectives"
The following 8 files are in this category, out of 8 total.
-

-
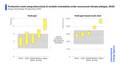
 Current share of global production capacity by country.png 1,920 × 1,080; 69 KB
-
 Electrolysis Production Costs.png 1,920 × 1,080; 65 KB
-
 Investment in Clean Technology Supply Chains.png 1,920 × 1,080; 78 KB
-
 Main net trade flows for EV batteries, 2021.png 1,920 × 1,080; 223 KB
-
 Main net trade flows for solar PV modules, 2021.png 1,920 × 1,080; 221 KB
-
 Main net trade flows for wind turbines, 2021.png 1,920 × 1,080; 237 KB
-
 Market sizes for key clean technologies supply.png 1,920 × 1,080; 54 KB


