Category:Human genetics
Bước tới điều hướng
Bước tới tìm kiếm
study of genes, heredity, and variation in humans  | |||||
| Tải lên phương tiện | |||||
| Là một |
| ||||
|---|---|---|---|---|---|
| Là tập hợp con của | |||||
| Gồm có | |||||
| |||||
Thể loại con
Thể loại này có 19 thể loại con sau, trên tổng số 19 thể loại con.
A
- Autism and genetics (40 F)
E
- Genetic epidemiology (2 F)
G
- Henry H. Goddard (1 F)
H
O
- OMIM (4 F)
P
R
- Race and genetics (13 F)
Tập tin trong thể loại “Human genetics”
200 tập tin sau nằm trong thể loại này, trong tổng số 251 tập tin.
(Trang trước) (Trang sau)-
De-Humangenetik.ogg 2,3 s; 22 kB
-
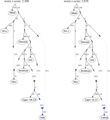
 13 Cluster Tree.png 1.230×904; 70 kB
-
 2QH7.png 960×720; 240 kB
-
 2RAM.png 960×720; 261 kB
-
 7ACN.jpg 775×650; 463 kB
-
-
-
-
A-Splice-Site-Mutation-in-Laminin-α2-Results-in-a-Severe-Muscular-Dystrophy-and-Growth-pone.0043794.s001.ogv 6,6 s, 1.600×1.200; 127 kB
-
A-Splice-Site-Mutation-in-Laminin-α2-Results-in-a-Severe-Muscular-Dystrophy-and-Growth-pone.0043794.s002.ogv 6,6 s, 1.600×1.200; 167 kB
-
Adenovirus-Mediated-Efficient-Gene-Transfer-into-Cultured-Three-Dimensional-Organoids-pone.0093608.s002.ogv 9,0 s, 1.920×1.080; 440 kB
-
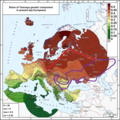
 ADMIXTURE analysis at K8 ancestral components with global populations.jpg 2.300×1.197; 623 kB
-
 ADMIXTURE analysis of indigenous Malaysians, Andamanese, and Malays.webp 1.668×2.358; 180 kB
-

-
 Admixture graph model Narsimhan et al. 2019.jpg 2.033×1.420; 317 kB
-

-
 Admixture graph of deep Eurasian lineages.png 3.885×3.932; 533 kB
-
 African phylogenetic structure projected on a map.png 2.881×2.505; 14,93 MB
-
 African population genomics ancestry map.png 2.948×2.736; 816 kB
-
 Allentoft et al. 2024 PCA.webp 2.102×1.576; 283 kB
-
 An Ancient Harappan Genome.jpg 1.080×860; 119 kB
-
-
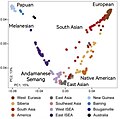
 Ancestry component analysis of South Asian populations.jpg 968×248; 63 kB
-
 Ancestry proportions for Sulawesi and North Moluccas.webp 2.121×657; 79 kB
-
 Ancient Comparison (SharedDNA) T1a1.png 1.002×408; 64 kB
-
 Ancient North African Iberomaurusian cline Afroasiatic origin model 2023.png 2.493×2.537; 11,4 MB
-

-
 Ancient North Eurasian network.png 6.111×2.729; 29,56 MB
-
 Ancient North Eurasians in context of West and East Eurasian Core populations.png 3.232×2.556; 6,25 MB
-
 Ancient North Siberian and Ancient North Eurasian.png 5.104×5.344; 57,13 MB
-
 ASEA map.png 3.157×1.591; 9,43 MB
-
 Asia-Pacific Principal Component analysis.jpg 2.120×1.843; 625 kB
-
 Asian TreeMix models.png 919×457; 70 kB
-
 Aurosomal-recessive.png 567×197; 11 kB
-

-

-

-

-

-
 Bell-Beaker mədəniyyəti(E.ə 2800-1800-cü illər).png 738×738; 315 kB
-
 Bronze to Iron Age Steppe peoples genetic makeup.png 592×766; 143 kB
-
 C1orf131 overview1.png 999×219; 44 kB
-
 C3orf70 Orthologs.png 732×581; 214 kB
-
 C3orf70 Percent Non-identity vs Date of Divergence.png 360×180; 23 kB
-
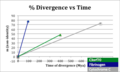 C3orf70 Rate of Divergence.png 354×212; 27 kB
-
 C7orf43 isoform 1 transcript.png 1.178×160; 155 kB
-
 Central Asian genetic makeup.jpg 988×4.255; 313 kB
-

-
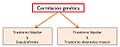 Correlación genética.jpg 554×219; 27 kB
-
CtIP-Mutations-Cause-Seckel-and-Jawad-Syndromes-pgen.1002310.s006.ogv 2,8 s, 1.024×1.024; 6,31 MB
-
CtIP-Mutations-Cause-Seckel-and-Jawad-Syndromes-pgen.1002310.s007.ogv 2,8 s, 1.024×1.024; 5,76 MB
-
 CXCR7.JPG 374×384; 21 kB
-
 CXorf26 multiple tissue expression levels.jpg 1.611×306; 191 kB
-
-
 Deep Tibetan admixture graph modeling.webp 1.350×1.478; 85 kB
-
 Demographic history of the Jomon lineage.jpg 3.000×4.203; 865 kB
-
 Discerning the Origins of the Negritos, First Sundaland People.jpg 1.500×1.135; 152 kB
-
-
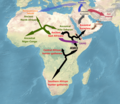
 Distribution of haplogroup E (YDNA) and migration routes.png 997×712; 56 kB
-
 Distrinution of basal haplogroups D, C and F.png 1.545×936; 1,41 MB
-
 DMDpav.png 600×911; 108 kB
-
 Domain structure of NCAMs.JPG 891×720; 56 kB
-
 East Asian PCA (including Jomon samples).png 879×781; 170 kB
-
 East-Eurasian phylogeny.png 5.337×2.877; 29,4 MB
-
 Eastern non-Africans.png 1.080×1.171; 499 kB
-

-
 Eurasian genetic ancestry components (K8).jpg 1.518×1.416; 405 kB
-
 Eurasian genetic PCA centered on Central Asians.jpg 3.800×3.943; 1,51 MB
-
 Eurasian PCA 2019.jpg 1.079×1.066; 157 kB
-
 Eurasian PCA with East Asian and Papuan ancestry estimation.jpg 1.079×494; 142 kB
-
 Expansion of paternal lineages D, C and F.png 836×612; 279 kB
-
 Família de nucleoplasmines.jpg 819×607; 70 kB
-
-
 Formal admixture tests involving ancient Leang Panninge data.jpg 2.918×2.508; 790 kB
-
 Formation process of regional population in mainland Japan.jpg 3.368×1.898; 554 kB
-
Function-and-Regulation-of-AUTS2-a-Gene-Implicated-in-Autism-and-Human-Evolution-pgen.1003221.s007.ogv 6,8 s, 1.360×1.024; 3,58 MB
-
Function-and-Regulation-of-AUTS2-a-Gene-Implicated-in-Autism-and-Human-Evolution-pgen.1003221.s008.ogv 7,3 s, 1.360×1.024; 4,21 MB
-
 Genetic affinities between ancient and modern populations.jpg 1.346×1.204; 179 kB
-

-
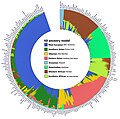 Genetic ancestry components (K8).jpg 3.244×3.216; 2,54 MB
-
 Genetic distance of worldwide populations.png 1.750×1.650; 389 kB
-
 Genetic Diversity in Asia Fig 2-B.jpg 752×656; 77 kB
-
 Genetic Diversity in Asia Fig 2-B.pdf 608×531; 2,07 MB
-
 Genetic formation of modern Tajik people.jpg 3.637×2.136; 2,01 MB
-
 Genetic history of Stone Age Eurasian.jpg 5.840×8.512; 16,71 MB
-
 Genetic links between Tibeto-Burman speakers.webp 2.001×1.275; 142 kB
-
 Genetic makeup of European populations.jpg 683×845; 113 kB
-
 Genetic makeup of South Asia.png 700×785; 81 kB
-
 Genetic makeup of the Saka and Scythian cultures.png 3.164×1.840; 12,82 MB
-
 Genetic structure of ancient Europe.webp 946×597; 77 kB
-

-
-

-
-
-
-
-
 Genotype-first approach.tif 2.542 × 2.194, 2 trang; 16,95 MB
-
 Genética Humana - py5aal.jpg 150×250; 48 kB
-
 Geographic location and dates of ancient individuals in Northern East Asia.png 1.715×1.761; 2,04 MB
-
 Geographical distribution of human major genetic ancestral components.jpg 7.752×4.688; 9,46 MB
-
 Global and Asian population genomic PCA and TreeMix models.png 1.054×1.200; 283 kB
-
 Global dispersal of humans recently inferred from genomic data.png 3.966×1.474; 3,43 MB
-

-
 Global PCA.png 1.054×349; 138 kB
-
 Haplogroup T-M184 tree.png 4.000×4.000; 2,45 MB
-
 Haplogrupo D (ADN-Y).png 839×486; 32 kB
-

-

-
-
 Historical and modern Kazakh samples on a Eurasian-wide PCA.png 1.249×816; 291 kB
-
 Hoabinhian East Asian cluster.png 1.058×805; 181 kB
-

-
 Human genetic ancestries (K4 - global).jpg 1.097×427; 109 kB
-
 Human genetic diverging tree.jpg 685×456; 42 kB
-
 Human genetic variant counts by region.svg 576×432; 18 kB
-
 Human geographical dispersion model (Eurasia).jpg 1.280×744; 127 kB
-
 Human migration routes following Out-of-Africa.png 2.560×1.314; 686 kB
-
-
 Human-mouse synteny.jpg 1.200×851; 161 kB
-
 Hun genome and y-chromosome haplogroups (Hungarian Hun).png 1.072×486; 38 kB
-
 Hun genome and y-chromosome haplogroups.png 1.072×982; 80 kB
-
-
-
-
 Huyết thống.jpg 324×230; 15 kB
-
-
 Illustrations for demographic history in East Asia.jpg 900×1.280; 139 kB
-
-
-
-
-
 Jomon ancestry of each region of Japan.jpg 3.371×1.809; 413 kB
-
 Jomon and Continental Asian contributions to modern Japanese.jpg 996×996; 164 kB
-
 K6 human genetic ancestries.png 1.498×1.642; 907 kB
-
-
-
-
-
 Manhattan plot from a GWAS of kidney stone disease.png 2.432×1.050; 918 kB
-
-

-
 Menschlicher Populationsstammbaum.png 651×701; 129 kB
-
 Migration of the Y chromosome haplogroup C, D, N and O.png 1.800×4.634; 4,1 MB
-
 Migration routes of modern humans (2023).png 2.560×1.424; 693 kB
-
 Migration routes of subtypes of Helicobacter pylori.png 1.281×703; 153 kB
-
 Minor allele frequency versus effect size.png 1.632×1.632; 316 kB
-
Mitochondria-Localize-to-the-Cleavage-Furrow-in-Mammalian-Cytokinesis-pone.0072886.s005.ogv 7,4 s, 960×980; 1,05 MB
-
Mitochondria-Localize-to-the-Cleavage-Furrow-in-Mammalian-Cytokinesis-pone.0072886.s006.ogv 6,4 s, 1.084×1.080; 971 kB
-
Mitochondria-Localize-to-the-Cleavage-Furrow-in-Mammalian-Cytokinesis-pone.0072886.s007.ogv 5,4 s, 780×740; 445 kB
-
Mitochondria-Localize-to-the-Cleavage-Furrow-in-Mammalian-Cytokinesis-pone.0072886.s008.ogv 4,3 s, 1.064×1.080; 548 kB
-
 Model for Philippine demographic history.jpg 2.676×3.344; 1,46 MB
-
 Neanderthal DNA Comparison (SharedDNA) T1a.png 1.989×547; 106 kB
-
-
-
-
 Offspring eye color.png 1.080×1.080; 496 kB
-
-
-
-
-
-
 Overall genetic position of worldwide populations.jpg 1.950×2.017; 401 kB
-
 Overview of the genetic history of the Bronze to Iron Age Eurasian Steppe.jpg 6.648×4.160; 7,21 MB
-
 Paveldimumas.png 2.000×3.556; 492 kB
-

-

-
 PCA model of Proper West-Eurasians, Basal-Eurasians, and Africans.png 1.713×875; 131 kB
-
 PCA of masked South Asian ancestry models.jpg 1.080×1.605; 199 kB
-

-

-
 Peopling of Eastern Eurasia.png 1.482×1.316; 180 kB
-
-
-
 Phylogenetic graph on formation of Native Americans.jpg 2.225×2.916; 396 kB
-
 Phylogenetic relationship of the ESEA lineage.png 1.139×607; 37 kB
-

-
 Phylogenetic structure of Africans.png 2.004×1.170; 960 kB
-
 Phylogenetic structure of Eastern Eurasians.png 2.472×1.536; 1,45 MB
-
 Phylogenetic structure of Western Eurasians.png 3.528×2.140; 1,86 MB
-
 Phylogenetic T-M184 tree.png 4.000×4.000; 2,91 MB
-
 Phylogenetic tree for ancient Eurasians.png 1.492×776; 178 kB
-
 Phylogenetic tree of F23 (Jomon) and modern humans.jpg 2.122×1.520; 353 kB
-
 Phylogeny of the ANEA ASEA lineages (detailed).png 1.027×605; 68 kB
-
 Population genome tree (SAsia or AASI).png 520×1.036; 79 kB
-
 Population genomic data of Central Asians.png 1.048×698; 169 kB
-
 Population genomics (worldwide sampling).png 685×456; 88 kB
-
 Population structure within Asia.jpg 1.180×480; 122 kB
-
 Populationen der Menschheit nach Cavalli-Sforza.png 2.000×1.086; 1,51 MB
-

-
 Predicted Cxorf26 by Swiss Model.JPG 278×367; 14 kB
-
-
 Principal Components Analysis of Ancient West Eurasians.jpg 2.233×1.755; 440 kB
-
-
-
-
-
PRTFDC1-Is-a-Genetic-Modifier-of-HPRT-Deficiency-in-the-Mouse-pone.0022381.s008.ogv 1 min 14 s, 640×480; 7,12 MB
-
 QpAdm model of Ulaanzuukh and Slab Grave remains.jpg 3.000×564; 205 kB
-
 QpAdm model of Ulaanzuukh, Slab Grave and Xiongnu TAK and SBB individuals.jpg 3.000×1.616; 448 kB


.png)


_and_migration_routes.png)


.png)


.jpg)


.jpg)


.png)


.jpg)


.png)


.png)


_(ANE_and_ANS).png)


_and_modern_humans.jpg)
.png)
.png)

.png)

.jpg)


_T1a1.png)
.png)
.jpg)
_T1a.png)