Category:Logarithmic scale
Jump to navigation
Jump to search
measurement scale based on orders of magnitude | |||||
| Upload media | |||||
| Subclass of |
| ||||
|---|---|---|---|---|---|
| Different from | |||||
| |||||
Subcategories
This category has the following 8 subcategories, out of 8 total.
Media in category "Logarithmic scale"
The following 98 files are in this category, out of 98 total.
-
 "Logarithm" Graph of Source of Water in Cubic Miles.png 985 × 644; 84 KB
-

-
 4octavesAndfrequenciesEars.jpg 577 × 96; 17 KB
-
 Alometric Equation - way of expressions.png 1,125 × 1,076; 181 KB
-
 Analyzing Hot DOG Galaxies (PIA15815).jpg 2,400 × 1,740; 222 KB
-
 Aparición de un pico.JPG 349 × 237; 15 KB
-
 Approximate log table.svg 149 × 588; 69 KB
-
 Comparaison echelle temporelle log et lin.svg 739 × 141; 85 KB
-
 Comparison of the sequence 1 to 10 and their logs to the base 10.png 347 × 757; 15 KB
-
 Cosh-semilogy.png 984 × 734; 23 KB
-
 DPBF.png 686 × 340; 11 KB
-
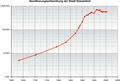 Duesseldorf Bevoelkerungsentwicklung 01 KMJ.png 768 × 520; 60 KB
-
 Echelle logarithmique.png 1,546 × 114; 3 KB
-
 Empty logarithmic scale.svg 4,436 × 586; 805 KB
-
 Escala logarítmica.jpg 444 × 61; 11 KB
-
 Exponentialschreibweise Beispiele.svg 512 × 384; 221 KB
-
 Exponentialschreibweise.svg 512 × 384; 204 KB
-
 Extended logarithmic universe illustration.png 2,400 × 2,400; 11.21 MB
-
 Extended universe logarithmic illustration (English annotated).png 2,400 × 2,400; 11.47 MB
-
 Fig 2- logistisk vækst med to vandrette asymptoter.png 829 × 303; 30 KB
-
 Five decades visualization.svg 1,598 × 990; 22 KB
-
-

-
 Graph--Ln y=Ln x-to-4=4 Ln x---log-log scales.png 326 × 458; 8 KB
-
 Graphic--y-e-to-05x--lin-log.png 300 × 483; 10 KB
-
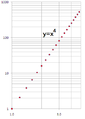 Graphic--y-x-to-4--log log.png 326 × 458; 7 KB
-
 Heriotza Tasa Covid19 eskala logaritmokoa Berria.png 1,156 × 782; 90 KB
-
 Horizontal logarithmic time scale (compressed).svg 1,215 × 136; 409 KB
-
 Internet host count 1988-2012 log scale.png 817 × 468; 10 KB
-
 Lalanne-calculator-chart-thumbnail.jpg 1,961 × 2,420; 6.67 MB
-
 Linea de Gunter.jpg 440 × 19; 4 KB
-
 Log-Achse.png 803 × 189; 9 KB
-
 Log-log plot example.svg 360 × 360; 6 KB
-
 Log-log.png 737 × 507; 19 KB
-
 Log-semilog.png 805 × 628; 11 KB
-
 Log-semilog.svg 600 × 480; 29 KB
-
 Logarithmic Plots.jpg 979 × 736; 39 KB
-
 Logarithmic scale- 2013-12-10 03-26.jpg 2,920 × 681; 770 KB
-
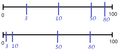
 Logarithmic scale.jpg 400 × 25; 2 KB
-
 Logarithmic scale.png 635 × 111; 2 KB
-
 Logarithmic scale.svg 635 × 111; 2 KB
-
 Logarithmic Scales mk.svg 761 × 732; 184 KB
-
 Logarithmic Scales no text.svg 748 × 702; 56 KB
-
 Logarithmic Scales-mkII.svg 761 × 732; 17 KB
-
 Logarithmic Scales.svg 761 × 732; 60 KB
-
 Logarithmic time scale - milliseconds to years (extended).svg 7,000 × 100; 502 KB
-
 Logarithmic time scale - milliseconds to years.svg 1,878 × 100; 454 KB
-
 Logarithmic time scale.png 6,338 × 1,236; 447 KB
-
 Logistisk graf med to vandrette asymptoter.png 830 × 290; 29 KB
-
 Logistisk graf.png 522 × 373; 17 KB
-
 Logistisk vækst og eksponentiel vækst.png 825 × 340; 42 KB
-
 LogLinAxes.png 593 × 130; 13 KB
-
 LogLogPlot of Line.GIF 485 × 392; 8 KB
-
 LogLogScale.svg 512 × 512; 15 KB
-
 LogPapierXBeispiel.PNG 434 × 314; 5 KB
-
 LogPapierXYBeispiel.PNG 454 × 437; 7 KB
-
 LogPapierYBeispiel.PNG 448 × 429; 6 KB
-
 MTF bars logaritmic.png 391 × 94; 394 bytes
-
 NIF output over 11 years without legend.png 1,244 × 768; 386 KB
-
 NIF output over 11 years.png 1,244 × 991; 535 KB
-
 Observable Universe Chinese Annotations.png 2,100 × 2,100; 7.81 MB
-
 Observable Universe logarithmic illustration (circular layout english annotations).png 2,100 × 2,100; 7.76 MB
-
 Orders of magnitude (english annotations).png 640 × 2,520; 2.42 MB
-
 Orders of magnitude (no annotations).png 640 × 2,520; 2.4 MB
-
 Particle size comparison for different kinds of grease filters.jpg 229 × 234; 31 KB
-
 PIA16460-Mars-AtmophereGases-20121102.jpg 920 × 598; 36 KB
-
 PopulationEngland 1086-2010.svg 1,568 × 779; 50 KB
-
 PopulationEngland.svg 933 × 687; 42 KB
-
 Power functions on logarithmic scale.svg 2,200 × 2,200; 71 KB
-
 Proportion of abundant numbers.svg 540 × 360; 133 KB
-
 QPxTool DVD error rate graph.png 902 × 535; 63 KB
-
 Reference ranges for blood tests - by mass.png 6,798 × 585; 1.5 MB
-
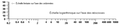
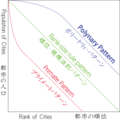 Relation between cities' population and cities' rank.png 619 × 619; 70 KB
-
 RichmondHillLog.png 1,000 × 700; 2.01 MB
-
 Root-2-3-5-loglog.svg 640 × 400; 23 KB
-
 Rød logistisk graf med tydelig symmetri.png 828 × 318; 40 KB
-
 Scala logaritmica con interi.jpg 732 × 104; 5 KB
-
 Scala logaritmica con potenze di 10.jpg 410 × 77; 4 KB
-
 Semilog graph paper.svg 700 × 700; 44 KB
-
 Six decades visualization.png 1,705 × 1,057; 15 KB
-
 SolarSystem Radii and Period (math).svg 665 × 855; 64 KB
-
 SolarSystem Radii and Period.svg 665 × 855; 49 KB
-
 Sqrt-plot-doppellog.png 813 × 465; 9 KB
-
 Sqrt-plot-doppellog.svg 840 × 480; 16 KB
-
 Three decades x10.png 772 × 964; 4 KB
-
 Three decades.png 772 × 964; 3 KB
-
 Three decades.svg 912 × 1,000; 335 bytes
-
 Umysłowa oś liczbowa.png 625 × 273; 5 KB
-
 Urtarrileko grafika logaritmikoa.png 970 × 604; 3 KB
-
 US Census 2010 Surnames Power Law.svg 732 × 551; 491 KB
-
Visually-straight-lines-on-log-log-plots.webm 6 min 5 s, 1,920 × 1,080; 23.37 MB
-
 Vorlage Buchungspapier (Alter Fritz).pdf 1,239 × 1,752; 347 KB
-
 Williamson amplifier with Audio Development 314E transformer.png 1,547 × 1,026; 684 KB
-
 Williamson amplifier with Peerless S265Q transformer.png 1,528 × 1,037; 999 KB
-
 Wound healing phases-ar.png 6,338 × 1,236; 786 KB
-
 Wound healing phases.png 6,338 × 1,236; 859 KB
-
 Wound healing phases.svg 713 × 139; 439 KB
-
 Échelle benford.gif 844 × 174; 3 KB


.jpg)


.png)


.png)


.svg)


.svg)
.svg)
.png)
.png)