Category:Matplotlib SVG substitution
Jump to navigation
Jump to search


These plots were formerly produced by matplotlib but have been replaced by ones with more efficient SVG encodings.
Media in category "Matplotlib SVG substitution"
The following 5 files are in this category, out of 5 total.
-
 Logarithmic Spiral Pylab.svg 512 × 512; 5 KB
-
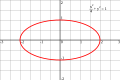 Ellipse in coordinate system with semi-axes labelled.svg 512 × 341; 2 KB
-
 Sinc function (normalized).svg 908 × 623; 4 KB
-
 Dirichlet kernels.svg 720 × 495; 57 KB
-
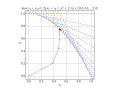 Karmarkar.svg 720 × 540; 43 KB


.svg)

