Category:Operations research
Jump to navigation
Jump to search
discipline that deals with the application of advanced analytical methods to help make better decisions | |||||
| Upload media | |||||
| Instance of |
| ||||
|---|---|---|---|---|---|
| Subclass of | |||||
| Said to be the same as | Q106376158 | ||||
| |||||
Subcategories
This category has the following 24 subcategories, out of 24 total.
*
B
C
- CyberSyn (11 F)
D
E
- Event chain methodology (11 F)
F
G
- Gradient descent (31 F)
I
L
- Lorenz attractors (1 P, 92 F)
M
N
O
S
T
- Traveling salesman problem (38 F)
V
Media in category "Operations research"
The following 124 files are in this category, out of 124 total.
-

-
 AgKorlatosBackTrackv2.gif 2,350 × 1,000; 281 KB
-
 AntColony.gif 860 × 321; 288 KB
-
 Bias Correction.png 436 × 376; 13 KB
-
 BosniaConfrontation0.JPG 1,009 × 427; 120 KB
-
 BosniaConfrontation1.JPG 764 × 425; 94 KB
-
 BosniaConfrontation2.JPG 764 × 436; 98 KB
-
 BosniaConfrontation3.JPG 764 × 425; 91 KB
-
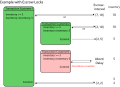
 Bow-tie diagram.jpg 1,057 × 505; 85 KB
-
 Branch and Bound.png 704 × 500; 33 KB
-
 Calculadora práctica.jpg 2,448 × 2,253; 1.22 MB
-
 Cerdec logo1.jpg 402 × 85; 14 KB
-
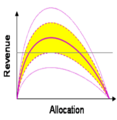
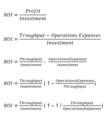 Chart 5 - Mathematical ROI Function.png 576 × 627; 25 KB
-
 Classification of energy system models.svg 641 × 641; 80 KB
-
 Colas.png 459 × 134; 3 KB
-
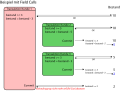
 Database hotspot field calls english.svg 732 × 545; 110 KB
-
 Database hotspot field calls german.svg 725 × 545; 108 KB
-
 DEA CRS ex.png 426 × 426; 12 KB
-
 DEA DRS ex.png 596 × 589; 14 KB
-
 DEA FDH ex.png 424 × 423; 8 KB
-
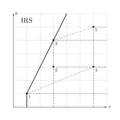 DEA IRS ex.png 425 × 425; 10 KB
-
 DEA IRS exemple.png 421 × 399; 10 KB
-
 DEA VRS ex.png 424 × 424; 10 KB
-
 Dependency network for financial data.jpg 432 × 306; 27 KB
-
 Dependency network for immune system data.jpg 442 × 222; 39 KB
-
 Dependency network for semantic data.jpg 177 × 162; 13 KB
-
 Design Management in brief.jpg 825 × 573; 121 KB
-
 Different simulation methods(rus).PNG 500 × 298; 64 KB
-
 Different simulation methods.JPG 500 × 295; 56 KB
-
 Dinic algorithm G1.svg 1,311 × 567; 7 KB
-
 Dinic algorithm G2.svg 1,311 × 567; 7 KB
-
 Dinic algorithm G3.svg 1,311 × 567; 7 KB
-
 Dinic algorithm Gf1.svg 1,311 × 567; 7 KB
-
 Dinic algorithm Gf2.svg 1,311 × 638; 10 KB
-
 Dinic algorithm Gf3.svg 1,311 × 567; 10 KB
-
 Dinic algorithm GL1.svg 1,311 × 567; 6 KB
-
 Dinic algorithm GL2.svg 1,311 × 567; 5 KB
-
 Dinic algorithm GL3.svg 1,311 × 567; 3 KB
-
 Dm-definition.pdf 1,620 × 1,168; 151 KB
-
 DMI conference.jpg 1,350 × 900; 1.54 MB
-
 DW Block Angular Matrix.jpg 417 × 330; 10 KB
-
 East River Valley Trophic Web.jpg 3,508 × 2,323; 4.08 MB
-
 EileKlaipedojePrieBilietu.jpg 1,632 × 1,224; 841 KB
-
 Electric deflection CNT.JPG 286 × 114; 7 KB
-
 EPQ Graph.jpg 659 × 568; 22 KB
-
 ER model.png 1,704 × 429; 25 KB
-
 ER model.svg 1,704 × 429; 714 bytes
-
 EURO Journals.jpg 368 × 557; 52 KB
-
 EURO Member Countries.svg 2,754 × 1,398; 1.11 MB
-
 EVIU comparison.png 543 × 260; 9 KB
-
 EVIU diagram.png 380 × 460; 16 KB
-
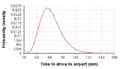 EVIU time to drive to airport.png 417 × 241; 8 KB
-
 EVSI diagram.png 541 × 532; 15 KB
-
 EVSI prior marginals.png 692 × 232; 8 KB
-
 EVSI result.png 669 × 199; 5 KB
-
 EVSI trial data.png 688 × 242; 13 KB
-
 Extrema example bg.png 1,280 × 1,024; 71 KB
-
 Extrema example no.png 938 × 673; 56 KB
-
 Extrema example original fa.svg 600 × 480; 13 KB
-
 Extrema example original hi.svg 600 × 480; 29 KB
-
 Extrema example original.svg 600 × 480; 69 KB
-
 Facility location.png 725 × 325; 13 KB
-
 Figura2.png 554 × 547; 9 KB
-
 Figure illustrating the vehicle routing problem.png 448 × 297; 5 KB
-
 Flow Shop Ordonnancement.JPEG 1,087 × 298; 30 KB
-

-
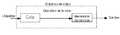
 Fork-join-queue.svg 765 × 297; 14 KB
-
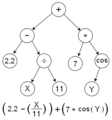 Genetic Program Tree.png 298 × 318; 15 KB
-
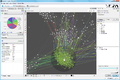 GephiScreenshot.png 1,318 × 880; 572 KB
-
 Hotspot escrow locks english2.svg 755 × 544; 91 KB
-
 Hotspot escrow locks german.svg 754 × 544; 91 KB
-
 IGT-example10.png 428 × 291; 7 KB
-
 IGT-example12.png 274 × 280; 37 KB
-
 IGT-example13.png 274 × 279; 29 KB
-
 IGT-example14.png 274 × 281; 36 KB
-
 Integralita.png 421 × 397; 5 KB
-
 Inventory Build Up Diagram.JPG 2,448 × 2,448; 1.26 MB
-
 Job Shop Ordonnancement.JPEG 987 × 587; 47 KB
-
 JumperInputScreen1.jpg 988 × 1,167; 146 KB
-
 KapitzaPendulumScheme.gif 2,000 × 1,500; 16 KB
-
 KapizaPendulumUpPosition.jpg 1,200 × 900; 120 KB
-
 Local maximum.png 399 × 203; 40 KB
-
 Logo image 300.jpg 300 × 83; 40 KB
-
 M218a1f2.gif 474 × 487; 59 KB
-
 Machine Parallèles Ordonnancement.JPEG 1,002 × 454; 41 KB
-
 Machine unique Ordonnant.JPEG 1,002 × 298; 29 KB
-
 Manual decision tree.jpg 400 × 473; 72 KB
-
 Map of EURO President Nationalities.svg 680 × 520; 800 KB
-
 Map of vrp subproblems.jpg 643 × 449; 30 KB
-
 MCDMFigure1.png 976 × 733; 58 KB
-
 MCDMFigure2.png 976 × 810; 65 KB
-
 MCDMFigure3.png 605 × 466; 43 KB
-
 Mimo.PNG 802 × 229; 8 KB
-
 Minimizationcomp.JPG 525 × 364; 61 KB
-
 Minimizationproc.JPG 474 × 626; 77 KB
-
 Minimizationvib.JPG 657 × 216; 38 KB
-
 Mmalgorithm.jpg 474 × 322; 21 KB
-
 Modelo ampliado.jpg 960 × 720; 42 KB
-
 MSE of ML vs JS.png 1,550 × 1,262; 9 KB
-
 Nearestneighbor.gif 393 × 287; 662 KB
-
 Nieaaddress.jpg 793 × 449; 163 KB
-
 Normalized radial basis functions.svg 460 × 422; 2 KB
-
 Optimal tour traveling salesman problem Germany.gif 612 × 792; 64 KB
-
OptimalPublicHealth2020-09-29.webm 36 min 7 s, 640 × 360; 124.92 MB
-
 Optimalpunkt Optimalwert.jpg 1,200 × 800; 43 KB
-
 Partitioned network.jpg 2,400 × 2,400; 246 KB
-
 Ricerca operativa problemi assegnazione.png 618 × 476; 73 KB
-
 Risk Analysis, evaluation, assesment, and management.jpg 719 × 340; 53 KB
-
 Sample Network.jpg 2,040 × 1,709; 173 KB
-
 Sethi-control.JPG 555 × 137; 6 KB
-
 Shortest path optimal substructure.png 200 × 107; 5 KB
-
 Simple LPM stock and flow.png 479 × 359; 61 KB
-
 SimpleAONwDrag3.png 960 × 720; 139 KB
-
 Simulation approaches vs abstraction levels(rus).PNG 563 × 418; 36 KB
-
 Structure hiérarchique.JPG 888 × 300; 37 KB
-
 Synergies organisationnelles.svg 676 × 380; 13 KB
-
 TARDEC LOGO 051509 LargeOnBlack.jpg 3,000 × 1,638; 544 KB
-
 Template Method UML.svg 468 × 485; 18 KB
-
 Transportation Model Visualization 4 Suppliers.jpg 746 × 701; 93 KB
-
 Unnormalized radial basis functions.svg 460 × 422; 2 KB
-
 Watts-Strogatz-rewire.png 2,243 × 667; 69 KB
-
 Weighted network.png 430 × 195; 12 KB
-
 Weighted network.svg 430 × 195; 5 KB
-
 YYL1.png 1,157 × 629; 77 KB


.PNG)


.PNG)


