Category:Our World in Data - Population and Demographic Change
Jump to navigation
Jump to search
Subcategories
This category has only the following subcategory.
Media in category "Our World in Data - Population and Demographic Change"
The following 200 files are in this category, out of 262 total.
(previous page) (next page)-
 Absolute increase in global population per year, OWID.svg 850 × 600; 10 KB
-
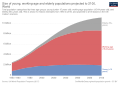
 Age dependency breakdown by young and old dependents, OWID.svg 850 × 600; 22 KB
-
 Age dependency ratio projected to 2100, OWID.svg 850 × 600; 23 KB
-
 Annual number of births by world region, OWID.svg 850 × 600; 20 KB
-
 Annual number of deaths by world region, OWID.svg 850 × 600; 20 KB
-
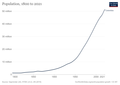
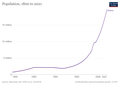
 Annual World Population Since 10,000 BC.png 2,674 × 1,881; 209 KB
-
 Annual-World-Population-since-10-thousand-BCE-1-768x724.png 747 × 677; 111 KB
-

-
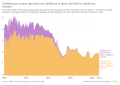
 Average number of children vs child mortality, OWID.svg 850 × 600; 38 KB
-

-
 Birth and Death Rates.png 1,656 × 1,048; 176 KB
-
 Birth rate vs Death rate, OWID.svg 850 × 600; 41 KB
-

-
 Bolivia-demography.png 3,400 × 2,400; 283 KB
-
 Burundi-Demography.png 3,400 × 2,400; 294 KB
-
 By age group- The growth of the population to 2100, OWID.svg 850 × 600; 31 KB
-
 Central African Republic-demography.png 3,400 × 2,400; 271 KB
-
 Chad-demography.png 3,400 × 2,400; 296 KB
-
 Children per woman (fertility rate) vs. level of prosperity, OWID.svg 850 × 600; 114 KB
-
 Children per woman by GDP per capita, OWID.svg 850 × 600; 34 KB
-
-
 Children per woman vs population growth, OWID.svg 850 × 600; 43 KB
-
 Children per woman vs. Human Development Index, OWID.svg 850 × 600; 35 KB
-
 Children per woman, 1, OWID.svg 850 × 600; 101 KB
-
 Children per woman, OWID.svg 850 × 600; 12 KB
-

-
 Children-per-woman-UN.png 3,400 × 2,400; 312 KB
-
 City population, OWID.svg 850 × 600; 5 KB
-
 Colombia-demography.png 3,400 × 2,400; 290 KB
-

-
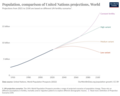 Comparison-of-world-population-projections.png 3,400 × 2,706; 552 KB
-
 Cote d Ivoire demography.png 3,400 × 2,400; 331 KB
-
 Demographic-Transition-5-countries.png 2,999 × 2,025; 413 KB
-
 Demographic-TransitionOWID.png 2,364 × 1,875; 258 KB
-

-

-
 European urban population shares from 1500-1980, OWID.svg 850 × 600; 13 KB
-
 Fertility and female labor force participation, OWID.svg 850 × 600; 100 KB
-
 Fertility and wanted fertility, OWID.svg 850 × 600; 11 KB
-
 Fertility rate of France overtime from 1800 to 2016.svg 850 × 600; 45 KB
-
 Fertility rate of Russia from 1843 to 2016.svg 850 × 600; 42 KB
-
 Fertility rate of the United Kingdom from 1541 to 2019.svg 850 × 600; 71 KB
-
 Fertility rate of the United States from 1820 to 2016.svg 850 × 600; 43 KB
-
 Fertility rate vs the share living in extreme poverty, OWID.svg 850 × 600; 28 KB
-
 Fertility rate vs. contraceptive prevalence, OWID.svg 850 × 600; 12 KB
-
 Fertility rate vs. mean years of schooling, OWID.svg 850 × 600; 24 KB
-
 Fertility vs wanted fertility, OWID.svg 850 × 600; 19 KB
-

-

-
 Future-as-triangles-of-an-hour-glass-02.png 7,124 × 9,672; 3.63 MB
-
 Gambia demography.png 3,400 × 2,400; 279 KB
-

-

-

-

-

-
 Global population after 1820.png 1,559 × 987; 121 KB
-
 Global population cartogram.png 8,192 × 3,131; 1.01 MB
-
 Global Population, 1300-2021.png 1,636 × 1,012; 145 KB
-
 Global Population-Pyramid-1950-to-2100.jpg 3,000 × 2,082; 3.47 MB
-
 Global-land-use-since-10000bc (OWID 0541).png 850 × 600; 52 KB
-
 Global-land-use-since-1000bc (OWID 0540).png 850 × 600; 53 KB
-
 Great Britain Population, 1700-1905.png 1,648 × 1,014; 129 KB
-
 Growth Rate vs Median Age, 2021.png 1,246 × 1,028; 239 KB
-
 Haiti-demographie.png 3,400 × 2,400; 285 KB
-
 Historic and projected population, OWID.svg 850 × 600; 13 KB
-
 Historic population of Algeria.svg 850 × 600; 47 KB
-
 Historic population of Indonesia.svg 850 × 600; 45 KB
-
 Historic population of Italy.svg 850 × 600; 48 KB
-
 Historical population of Australia.svg 850 × 600; 48 KB
-
 Historical population of Austria.svg 850 × 600; 48 KB
-
 Historical population of Brazil.svg 850 × 600; 48 KB
-
 Historical population of Bulgaria.svg 850 × 600; 45 KB
-
 Historical population of Canada.svg 850 × 600; 45 KB
-
 Historical population of Cuba.svg 850 × 600; 45 KB
-
 Historical population of Egypt.svg 850 × 600; 49 KB
-
 Historical population of France.svg 850 × 600; 48 KB
-
 Historical population of Germany.svg 850 × 600; 48 KB
-
 Historical population of Hungary.svg 850 × 600; 47 KB
-
 Historical population of India and China.svg 850 × 600; 49 KB
-
 Historical population of Iran.svg 850 × 600; 48 KB
-
 Historical population of Iraq.svg 850 × 600; 48 KB
-
 Historical population of Ireland.svg 850 × 600; 48 KB
-
 Historical population of Japan.svg 850 × 600; 48 KB
-
 Historical population of Mexico.svg 850 × 600; 48 KB
-
 Historical population of Mongolia.svg 850 × 600; 49 KB
-
 Historical population of Nepal.svg 850 × 600; 47 KB
-
 Historical population of Nigeria.svg 850 × 600; 46 KB
-
 Historical population of Pakistan.svg 850 × 600; 45 KB
-
 Historical population of Peru.svg 850 × 600; 48 KB
-
 Historical population of Poland.svg 850 × 600; 49 KB
-
 Historical population of Portugal.svg 850 × 600; 48 KB
-
 Historical population of Rwanda.svg 850 × 600; 45 KB
-
 Historical population of Saudi Arabia.svg 850 × 600; 49 KB
-
 Historical population of South Africa.svg 850 × 600; 46 KB
-
 Historical population of Spain.svg 850 × 600; 48 KB
-
 Historical population of Sri Lanka.svg 850 × 600; 44 KB
-
 Historical population of Sweden.svg 850 × 600; 48 KB
-
 Historical population of Switzerland.svg 850 × 600; 48 KB
-
 Historical population of the DR Congo.svg 850 × 600; 44 KB
-
 Historical population of the Philippines.svg 850 × 600; 43 KB
-
 Historical population of the UAE.svg 850 × 600; 41 KB
-
 Historical Population of Tunisia.svg 850 × 600; 48 KB
-
 Historical population of Turkey.svg 850 × 600; 48 KB
-
 Historical population of Vietnam.svg 850 × 600; 45 KB
-
 Historical population of Yemen.svg 850 × 600; 49 KB
-
 Historical population of Zimbabwe.svg 850 × 600; 46 KB
-

-
 Honduras-demography.png 3,400 × 2,400; 287 KB
-
 Illustration of contemporary and past human populations Our World in Data.png 5,201 × 7,747; 2.4 MB
-
 Illustration of past, present and future population sizes (Our World in Data).png 1,781 × 2,418; 2.51 MB
-
 Jamaica-demography.png 3,400 × 2,400; 331 KB
-
 Korea-South-demography.png 3,400 × 2,400; 281 KB
-
 Laos-demography.png 3,400 × 2,400; 294 KB
-
 Lesotho-demography.png 3,400 × 2,400; 270 KB
-
 Libya-demography.png 3,400 × 2,400; 288 KB
-
 Life expectancy (years) vs. Real GDP per capita (2011US$), OWID.svg 850 × 600; 32 KB
-

-
 Life expectancy at age 10, OWID.svg 850 × 600; 14 KB
-
 Life expectancy at age 15 by sex, OWID.svg 850 × 600; 16 KB
-
 Life expectancy at age 45, OWID.svg 850 × 600; 16 KB
-
 Life Expectancy at birth (OECD data), OWID.svg 850 × 600; 28 KB
-
 Life expectancy at birth by sex, OWID.svg 850 × 600; 17 KB
-
 Life expectancy at birth vs. CO₂ emissions per capita, OWID.svg 850 × 600; 43 KB
-
 Life expectancy at birth, including the UN projections, OWID.svg 850 × 600; 11 KB
-
 Life expectancy by world region, from 1770 to 2018.svg 850 × 600; 42 KB
-
 Life expectancy by world region, OWID.svg 850 × 600; 15 KB
-
 Life expectancy in Armenia and Azerbaija.svg 850 × 600; 39 KB
-
 Life expectancy in North Korea and South Korea.svg 850 × 600; 41 KB
-
 Life expectancy in Serbia and Montenegro.svg 850 × 600; 39 KB
-
 Life expectancy in Spain and Portugal.svg 850 × 600; 42 KB
-
 Life expectancy in Ukraine and Russia.svg 850 × 600; 43 KB
-
 Life expectancy in USA and Canada.svg 850 × 600; 47 KB
-
 Life expectancy of women vs life expectancy of men, OWID.svg 850 × 600; 39 KB
-

-
 Life expectancy vs. GDP per capita, OWID.svg 850 × 600; 33 KB
-
 Life expectancy vs. health expenditure per capita, OWID.svg 850 × 600; 36 KB
-
 Life expectancy vs. health expenditure, OWID.svg 850 × 600; 40 KB
-
 Life expectancy vs. healthcare expenditure, OWID.svg 850 × 600; 40 KB
-
 Life expectancy vs. Liberal Democracy Index, OWID.svg 850 × 600; 35 KB
-
 Life expectancy vs. Political regime, OWID.svg 850 × 600; 34 KB
-
 Life expectancy vs. trust in health professionals, OWID.svg 850 × 600; 29 KB
-
 Life expectancy, OWID.svg 850 × 600; 13 KB
-
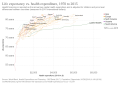
 Life satisfaction vs Life expectancy, OWID.svg 850 × 600; 31 KB
-
 Life satisfaction vs. Child mortality, OWID.svg 850 × 600; 31 KB
-
 Life-expectancy.png 3,400 × 2,706; 643 KB
-
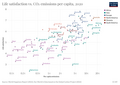 Life-satisfaction-vs-co-emissions-per-capita (OWID 0575).png 850 × 600; 82 KB
-
 Madagascar-demography.png 3,400 × 2,400; 336 KB
-
 Malawi-demography.png 3,400 × 2,400; 273 KB
-
 Mali-demography.png 3,400 × 2,400; 282 KB
-
 Median age of the United Kingdom overtime and projections.svg 850 × 600; 28 KB
-
 Median age vs. children per woman, OWID.svg 850 × 600; 49 KB
-
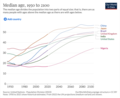 Median Age, 1950-2100.png 1,248 × 1,024; 186 KB
-

-
 Mongolia-demography.png 3,400 × 2,400; 280 KB
-
 Mozambique-demography.png 3,400 × 2,400; 293 KB
-
 Niger-demography.png 3,400 × 2,400; 287 KB
-
 Number of births and deaths per year, OWID.svg 850 × 600; 13 KB
-
 Number of children under 5 years old, OWID.svg 850 × 600; 22 KB
-
 Number of one-year-olds, OWID.svg 850 × 600; 9 KB
-
 Paraguay-demography.png 3,400 × 2,400; 292 KB
-
 Percentage of Americans living alone (1900-2016), OWID.svg 850 × 600; 12 KB
-
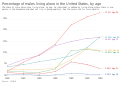
 Percentage of Americans living alone, by age, OWID.svg 850 × 600; 11 KB
-

-
-
 Population (Gapminder and UN (1800 to 2019)), OWID.svg 850 × 600; 18 KB
-
 Population by age bracket with UN projections, OWID.svg 850 × 600; 28 KB
-
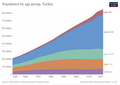
 Population by age group in Turkey.svg 624 × 440; 68 KB
-
 Population by broad age group projected to 2100, OWID.svg 850 × 600; 33 KB
-
 Population by broad age group, OWID.svg 850 × 600; 30 KB
-
 Population by country (Clio Infra (1500 to 2000)), OWID.svg 850 × 600; 16 KB
-
 Population by income level (World Bank), OWID.svg 850 × 600; 13 KB
-
 Population control.jpg 831 × 545; 70 KB
-
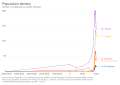 Population density, OWID.svg 850 × 600; 17 KB
-
 Population development of Argentina.svg 850 × 600; 46 KB
-
 Population development of Belgium.svg 850 × 600; 47 KB
-
 Population development of Chile.svg 850 × 600; 45 KB
-
 Population development of Denmark.svg 850 × 600; 48 KB
-
 Population development of Romania.svg 850 × 600; 47 KB
-
 Population development of Syria.svg 850 × 600; 47 KB
-
 Population development of the UK.svg 850 × 600; 45 KB
-
-
 Population growth rate by level of development, OWID.svg 850 × 600; 18 KB
-
 Population growth rate vs Child mortality rate, OWID.svg 850 × 600; 38 KB
-
 Population growth rate vs. median age, OWID.svg 850 × 600; 42 KB
-
 Population growth rate with and without migration, OWID.svg 850 × 600; 11 KB
-
 Population growth vs child mortality, OWID.svg 850 × 600; 35 KB
-

-
 Population Netherlands.svg 850 × 600; 47 KB
-

-
 Population projections of France by the UN up to 2100.svg 850 × 600; 35 KB
-
 Population South Sudan.svg 850 × 600; 36 KB
-
 Population younger than 15 years, OWID.svg 850 × 600; 5 KB
-
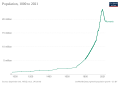
 Population, OWID.svg 850 × 600; 21 KB
-
 Population-and-demography.png 3,400 × 2,400; 365 KB
-
 Population-by-age-group-turkey.png 3,400 × 2,400; 414 KB
-
 Population-growth-rate-vs-median-age (OWID 0826).png 850 × 600; 99 KB
-
 Population-growth-rate-with-and-without-migration.png 3,197 × 1,860; 306 KB
-

-
 Population-past-future (OWID 0824).png 850 × 600; 79 KB


,_OWID.svg)


_vs._level_of_prosperity,_OWID.svg)


,_OWID.svg)


),_OWID.svg)


),_OWID.svg)
),_OWID.svg)


),_OWID.svg)


,_OWID.svg)


.png)
.png)


.png)


_vs._Real_GDP_per_capita_(2011US$),_OWID.svg)


,_OWID.svg)


.png)


,_OWID.svg)


),_OWID.svg)


),_OWID.svg)
,_OWID.svg)


),_OWID.svg)


.png)

.png)
.png)