Category:Our World in Data graphics about hunger and food security
Jump to navigation
Jump to search
Subcategories
This category has the following 2 subcategories, out of 2 total.
*
S
Media in category "Our World in Data graphics about hunger and food security"
The following 29 files are in this category, out of 29 total.
-
 Change-global-hunger-index-pop-growth (OWID 0160).png 850 × 600; 103 KB
-
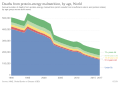 Deaths from protein-energy malnutrition, by age, OWID.svg 850 × 600; 12 KB
-
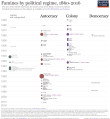 Famines by political regime.png 3,960 × 4,300; 428 KB
-
 Food supply vs life expectancy, OWID.svg 850 × 600; 34 KB
-
 Global Hunger Index vs. extreme poverty, OWID.svg 850 × 600; 62 KB
-
 Global Hunger Index vs. GDP per capita, OWID.svg 850 × 600; 23 KB
-
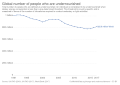 Global number of people who are undernourished, OWID.svg 850 × 600; 6 KB
-
 Hidden Hunger Index vs. extreme poverty, OWID.svg 850 × 600; 27 KB
-
 Hidden Hunger Index vs. GDP per capita, OWID.svg 850 × 600; 28 KB
-

-

-

-
 MDG1.C- Share of population undernourished, OWID.svg 850 × 600; 6 KB
-
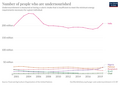
 Number of people defined as undernourished, OWID.svg 850 × 600; 7 KB
-

-
 Number of people who are severely food insecure, OWID.svg 850 × 600; 7 KB
-
 Number of people who are undernourished, 1, OWID.svg 850 × 600; 7 KB
-
 Number of people who are undernourished, OWID.svg 850 × 600; 15 KB
-
 Number of severely food insecure people by region, OWID.svg 850 × 600; 7 KB
-
 Number-of-severely-food-insecure-people-by-region.png 3,400 × 2,400; 502 KB
-
 Number-undernourished (OWID 0717).png 850 × 600; 63 KB
-
 Prevalence of severe food insecurity by region, OWID.svg 850 × 600; 9 KB
-

-

-

-

-
 Prevalence-of-severe-food-insecurity-by-region.png 3,400 × 2,400; 388 KB
-

-

.png)


.png)


.png)

_in_developing_countries_since_1970,_OWID.svg)


