Category:Population pyramids of the United States
Jump to navigation
Jump to search
Subcategories
This category has the following 2 subcategories, out of 2 total.
Media in category "Population pyramids of the United States"
The following 41 files are in this category, out of 41 total.
-
 Population pyramid of the United States from 2000 to 2100.gif 1,200 × 976; 757 KB
-
 US demographic composition population pyramid.gif 900 × 720; 5.32 MB
-
 Демографическая пирамида США в 1941 г..png 978 × 639; 31 KB
-
 Демографическая пирамида США в 1946 г..png 978 × 639; 21 KB
-
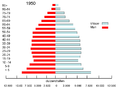 Population USA 1950.PNG 917 × 670; 22 KB
-
 USpop-1950.svg 800 × 600; 23 KB
-
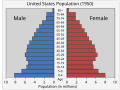
 USpop-2000.svg 800 × 600; 24 KB
-
 Pyramide Etats-Unis.PNG 902 × 625; 33 KB
-
 Us-2005.jpg 501 × 251; 33 KB
-
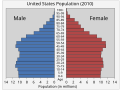 USpop2010.svg 800 × 600; 24 KB
-
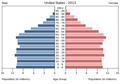 Population pyramid of the United States 2013.png 610 × 425; 85 KB
-
 Population pyramid of the United States 2014.png 610 × 425; 84 KB
-
 United States Population by Age Sex and Marital Status.svg 1,024 × 768; 168 KB
-
 US employment status by sex and age.svg 800 × 600; 13 KB
-
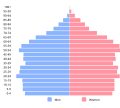
 USA by Sex and Age 2014-07-01.svg 1,024 × 768; 45 KB
-
 USA Sex by Age 20140601.png 978 × 640; 29 KB
-
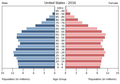
 Population pyramid of United States 2015.png 610 × 425; 84 KB
-
 USA by Sex and Age 2015-07-01.svg 1,024 × 768; 45 KB
-
 Population pyramid of the United States 2016.png 610 × 425; 84 KB
-
 PopulationPyramid USA.svg 500 × 450; 18 KB
-
 USA Bevölkerungspyramide.png 610 × 425; 94 KB
-
 United States Age Pyramid.svg 800 × 600; 13 KB
-
 US population pyramid (2018).jpg 610 × 425; 31 KB
-
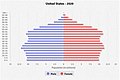 US population pyramid (2020).jpg 758 × 508; 105 KB
-
 USA2020dec1.png 1,537 × 1,310; 48 KB
-
 USA Population Pyramid.svg 2,822 × 2,418; 27 KB
-
 2030.PNG 932 × 685; 22 KB
-
 USpop-2050.svg 800 × 600; 24 KB
-
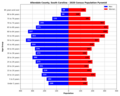 Allendale County, South Carolina Population Pyramid 2020 Census.png 3,000 × 2,400; 287 KB
-
 Bluffdale Population Pyramid 2016.png 477 × 341; 10 KB
-
 Minnesota population pyramid 2019.svg 900 × 540; 16 KB
-
 Minnesota population pyramid by age and race, 2022.svg 512 × 175; 12 KB
-
 New York city population pyramid in 2021.svg 2,693 × 2,057; 30 KB
-
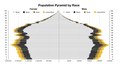 Population pyramid by race.pdf 2,927 × 1,656; 380 KB
-
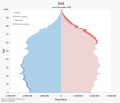
 US population pyramid 2022.jpg 1,200 × 700; 80 KB
-
 US Virgin Islands single age population pyramid 2020.png 2,212 × 1,777; 53 KB
-
 USA Ohio age pyramid.svg 520 × 600; 9 KB
-
 USA Tennessee age pyramid.svg 520 × 600; 8 KB
-
 USA Texas age pyramid.svg 520 × 600; 8 KB
-
 Ware Shoals Population Pyramid 2010 Census.jpg 1,022 × 937; 91 KB
-
 WestmontILUSAPopulationPyramid.png 728 × 481; 12 KB


.jpg)
.jpg)


