Category:Process flow diagrams
Jump to navigation
Jump to search
- (en) Process flow diagram
- (de) Fließbild
- (es) Diagrama de flujo
- (fr) schéma de procédé
- (he) תזרים תהליך
diagram indicating general flow of plant processes and equipment; typically used to show major relationships in chemical and process engineering | |||||
| Upload media | |||||
| Subclass of | |||||
|---|---|---|---|---|---|
| |||||
A process flow diagram (PFD) is a diagram commonly used in chemical and process engineering to indicate the general flow of plant processes and equipment.
Subcategories
This category has the following 2 subcategories, out of 2 total.
C
P
Pages in category "Process flow diagrams"
This category contains only the following page.
Media in category "Process flow diagrams"
The following 182 files are in this category, out of 182 total.
-
 A complex procedure composed of simpler procedures.svg 512 × 542; 34 KB
-
 Absorption chiller scheme.svg 744 × 744; 53 KB
-
 Absorptionskuehlung Abb 2.jpg 1,586 × 818; 109 KB
-
 AKM.png 510 × 891; 260 KB
-
 Aliran Proses Untuk Pembuatan Insulin.png 1,456 × 746; 57 KB
-
 AmineTreating.png 383 × 335; 5 KB
-
 Aminwäsche.jpg 8,660 × 5,454; 1.18 MB
-
 Anime production it.png 2,200 × 362; 87 KB
-
 Back Mixing and Digester.png 999 × 753; 47 KB
-
 Beyond User Stories - MMFs (Minimally Marketable Features).svg 512 × 384; 134 KB
-
 Binary sensor model.svg 850 × 567; 46 KB
-
 Biodieselblockdiagramm nach van Gerpen.png 1,285 × 576; 35 KB
-
 BiodieselBlockdiagramm.svg 965 × 235; 6 KB
-
 Biorieselbettreaktor nach VDI 3478-2.svg 640 × 545; 19 KB
-
 Biowaescher nach VDI 3478-1.svg 788 × 558; 34 KB
-
 BtL-Verfahrensschema.svg 744 × 1,052; 25 KB
-
 Carbon black production.svg 953 × 447; 292 KB
-

-
 Chaine conditionnement bacpro mei 2009.svg 662 × 616; 492 KB
-
 ChemSepProcDiagram.png 692 × 508; 3 KB
-
 ChemSepProcDiagram.svg 658 × 510; 5 KB
-
 Claus Sulfur Recovery.png 507 × 243; 10 KB
-
 Claus-Anlage.jpg 960 × 720; 58 KB
-
 Claus-Prozess.png 1,633 × 597; 71 KB
-
 ClausPlt.JPG 800 × 449; 51 KB
-
 Colloidal silica preparations.svg 700 × 450; 23 KB
-
 Compensatore idraulico.svg 1,100 × 650; 16 KB
-
 Continuous Binary Fractional Distillation EN.svg 664 × 699; 15 KB
-
 Continuous Binary Fractional Distillation fa.svg 664 × 699; 23 KB
-
 Continuous Binary Fractional Distillation-es.png 1,800 × 2,646; 311 KB
-
 Continuous Binary Fractional Distillation.PNG 1,736 × 2,552; 43 KB
-
 Continuous Fractional Distillation EN.svg 675 × 1,273; 18 KB
-
 Continuous Fractional Distillation ru.svg 542 × 1,155; 3 KB
-
 Continuous Fractional Distillation.PNG 300 × 490; 11 KB
-
 ConvKeroMerox.png 453 × 357; 14 KB
-
 ConvLPGMerox.png 559 × 529; 27 KB
-
 Crude Oil Distillation Unit.png 505 × 445; 24 KB
-
 Dampfreformierung (2).svg 932 × 488; 97 KB
-
 Dampfreformierung-Nummern.svg 1,920 × 1,080; 6 KB
-
 Dampfreformierung.svg 1,900 × 1,100; 6 KB
-
 Delayed Coker.png 596 × 488; 20 KB
-
 Demethanizer.PNG 340 × 364; 12 KB
-
 Destilery.gif 592 × 419; 15 KB
-
 Diagram obrazujący obieg przesyłek w systemie EZD.jpg 819 × 540; 114 KB
-
 Distillation sous vide.JPG 493 × 336; 16 KB
-
 DruckwechselRektifikation.svg 744 × 524; 278 KB
-
 Düngerherstellung.svg 1,600 × 2,000; 73 KB
-
 Electrolysis.JPG 826 × 384; 24 KB
-
 Electrumlab Gasbox.jpg 3,200 × 2,000; 2.25 MB
-
 Encebado de bombas2.png 890 × 512; 108 KB
-

-
 Engineering-Chemical-Process-PFD-Crude-Oil-Distillation-Unit.png 1,027 × 726; 82 KB
-
 Ethylene oxide production plant.svg 1,300 × 850; 120 KB
-
 Fabrication curly.jpg 574 × 464; 44 KB
-
 Feed Mix.png 865 × 574; 21 KB
-
 Fliessbild01.png 993 × 678; 153 KB
-
 Fliessbild02.png 907 × 593; 98 KB
-
 Fliessbild03.png 969 × 646; 103 KB
-
 Fließschema Syntheseprozess Tetraethylblei.svg 487 × 637; 247 KB
-
 Flowsheet for production of biodiesel in aspen plus.png 1,024 × 438; 55 KB
-
 Flujograma proceso gestion contractual.JPG 585 × 546; 62 KB
-
 Fonctionnement d'un terminal méthanier.jpg 985 × 692; 53 KB
-
 Gas black process.svg 780 × 390; 120 KB
-
 Gaswäscher allgemein.jpg 1,168 × 681; 60 KB
-
 Geib-Spevack.svg 767 × 862; 221 KB
-
 Ginplant.jpg 550 × 366; 51 KB
-
 Girdler.JPG 400 × 400; 21 KB
-
 Girdler.svg 870 × 1,000; 6 KB
-
 Gleichstromaustauscher.svg 921 × 1,506; 31 KB
-
 GP1 ProcessSchematic.png 1,559 × 741; 269 KB
-
 Grate-kiln flöde.jpg 813 × 256; 34 KB
-
 GTL process.GIF 1,138 × 1,058; 25 KB
-
 Haber process.png 300 × 230; 4 KB
-
 Haber-Bosch it.svg 2,517 × 866; 115 KB
-
 Haber-Bosch-En.svg 512 × 154; 881 KB
-
 Haber-Bosch-es.svg 2,517 × 866; 117 KB
-
 Haber-Bosch-fr.svg 2,517 × 866; 117 KB
-
 Haber-Bosch-mk.svg 512 × 154; 1.12 MB
-
 Haber-Bosch-Nummern.svg 3,700 × 1,200; 17 KB
-
 Haber-Bosch-tr.svg 512 × 154; 873 KB
-
 Haber-Bosch.svg 3,800 × 1,200; 12 KB
-
 Hall-heroult-kk-2008-12-31.png 585 × 512; 32 KB
-
 HDS Flow.png 546 × 332; 18 KB
-
 Herstellung Zement Beton.svg 744 × 1,052; 22 KB
-
 HFQ Technology Process Steps.jpg 2,103 × 1,024; 499 KB
-
 Hochofen 1965-2.png 4,095 × 2,817; 1.93 MB
-
 Hochofen 1965.png 5,892 × 4,052; 1.45 MB
-
 Hydrodesulfurierung Prozess-ar.png 1,274 × 458; 51 KB
-
 Hydrogen from natural gas schematics.jpg 913 × 601; 269 KB
-
 Hydrolysis of cellulose (Hägglund-Bergius).svg 1,817 × 469; 907 KB
-
 IGCC diagram fr.svg 1,052 × 744; 157 KB
-
 IGCC diagram.svg 975 × 538; 191 KB
-
 Impianto di produzione di ossido di etilene.png 1,300 × 850; 137 KB
-
 Impianto di produzione di ossido di etilene.svg 1,300 × 850; 166 KB
-
 ITmk3 Process diagram.svg 2,385 × 1,331; 174 KB
-
 Kaatsufujouhou-2.JPG 720 × 540; 36 KB
-
 Kaatsufujouhou.JPG 720 × 540; 35 KB
-
 Kalkherstellung gross.png 1,065 × 498; 100 KB
-
 Kalkherstellung.svg 800 × 600; 96 KB
-
 Kalkherstellungv2.png 1,300 × 913; 176 KB
-
 KalkherstellungV2.svg 800 × 600; 100 KB
-
 Koepchenwerk DSC8586.jpg 6,000 × 4,000; 14.19 MB
-
 Kontinuierliche fraktionierende binäre Destillation DE.svg 664 × 699; 17 KB
-
 Kontinuierliche fraktionierende Destillation DE.svg 675 × 1,273; 18 KB
-
 Krupp-Renn Process diagram.svg 716 × 412; 56 KB
-
-
 LNG Process Ar.png 662 × 1,002; 31 KB
-
 Melkeproduksjon.svg 612 × 792; 203 KB
-
 Metodo contacto pirita.svg 1,052 × 744; 417 KB
-
 Midrex Process diagram.svg 557 × 396; 91 KB
-
 MLCC-Manufacturing-Process.png 960 × 720; 177 KB
-
 NatGasProcessing ar.svg 744 × 524; 45 KB
-
 NatGasProcessing-es.svg 744 × 524; 57 KB
-
 NatGasProcessing.png 584 × 465; 22 KB
-
 NatGasProcessing.svg 744 × 524; 38 KB
-
 NaturalGasCondensate ar.svg 1,500 × 1,000; 216 KB
-
 NaturalGasCondensate en.svg 1,500 × 1,000; 31 KB
-
 NaturalGasCondensate.png 296 × 200; 7 KB
-
 Nixtamal.jpg 360 × 694; 32 KB
-
 Oil distillation tower BlockDiagram NT.PNG 800 × 720; 57 KB
-
 Oil field flow metering.svg 750 × 850; 94 KB
-
 Ostwald schem.svg 2,463 × 1,510; 235 KB
-
 Oxygen Reactor.png 779 × 481; 23 KB
-
 P&ID drawing template.jpg 1,180 × 610; 140 KB
-
 Petroleum distillation.png 950 × 564; 18 KB
-
 PGSS-Verfahren Brandin.png 1,134 × 569; 83 KB
-
 Phosphor production (bs).svg 925 × 660; 25 KB
-
 Phosphor production (de).svg 925 × 660; 13 KB
-
 Phosphor production (en)-mr.svg 925 × 660; 30 KB
-
 Phosphor production (en).svg 925 × 660; 13 KB
-
 Phosphor production-te.svg 925 × 660; 25 KB
-
 Pipeline cross connection.svg 540 × 270; 64 KB
-
 Platform Purification of Antibodies using Protein A.jpg 276 × 957; 104 KB
-
 Polietilene - produzione di HDPE e LLDPE.svg 1,052 × 900; 194 KB
-
 Polyvinyl chloride (PVC) production from suspension polymerization.svg 1,128 × 1,262; 46 KB
-
 Precedence Table2.jpg 2,443 × 480; 159 KB
-
 Process diagramm crude gas.svg 1,276 × 1,843; 9 KB
-
 Process of electronic Voting.png 685 × 801; 130 KB
-
 Process of Production of Soy Sauce.png 2,710 × 1,661; 498 KB
-
 Produktionsablauf Metallhüttenwerk Lübeck.png 5,892 × 4,052; 1.23 MB
-
 ProjectTinkertoy 031.jpg 6,068 × 1,893; 2.43 MB
-
 ProjectTinkertoy 032.jpg 5,858 × 2,224; 2.55 MB
-
 ProjectTinkertoy 033.jpg 5,873 × 2,765; 2.16 MB
-
 ProjectTinkertoy 036.jpg 7,751 × 2,795; 9.19 MB
-
 ProjectTinkertoy 037.jpg 5,513 × 3,532; 9.26 MB
-
 ProjectTinkertoy 038.jpg 5,948 × 3,427; 5.04 MB
-
 Raffinerie.PNG 1,712 × 928; 32 KB
-
 Ress.JPG 438 × 220; 15 KB
-
 Schem techn KClO3.svg 2,688 × 1,242; 229 KB
-
 Schema bioolej rychla pyrolyza.png 654 × 476; 12 KB
-
 Schema InstantKaffee.svg 415 × 748; 124 KB
-
 Schematisches Verfahrenfließbild des Zweidruckverfahrens.svg 1,140 × 764; 69 KB
-
 SchemeLOX.jpg 2,126 × 1,417; 304 KB
-
 Schmieröltankentlüftung.svg 600 × 500; 19 KB
-
 Schéma bloc1.svg 650 × 450; 37 KB
-
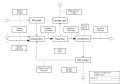 Schéma bloc2.svg 650 × 450; 47 KB
-
 Shema KP.JPG 1,213 × 644; 67 KB
-
 Siloreinigung1500x800.png 1,500 × 851; 200 KB
-
 Slaked lime production (example).svg 1,175 × 1,185; 47 KB
-
 Soap and Detergent manufacturing process 03.png 2,000 × 1,618; 261 KB
-
 Sodium hypochlorite process.png 881 × 346; 17 KB
-
 Steam cracking.svg 1,000 × 600; 25 KB
-
 Syngas Products.svg 1,160 × 475; 6 KB
-
 Synthesis SiO2 de.svg 558 × 556; 63 KB
-

-

-
 Tie Guan Yin processing chart zh.GIF 614 × 374; 10 KB
-
 Total Reflux.png 217 × 319; 7 KB
-
 TPSSimpleSchematic.jpg 872 × 380; 43 KB
-
 Variation-of-process-flow-diagram.jpg 480 × 363; 37 KB
-
 Veresterung2.jpg 523 × 535; 23 KB
-
 Verfahren zur Schwefelsäureherstellung.svg 1,470 × 957; 50 KB
-
 Verfahrensfließschema Zweidruckverfahren THF-Wasser.svg 1,091 × 756; 89 KB
-
 Verfahrensschema Luisenhall.svg 628 × 1,003; 24 KB
-
 Verfahrensschema SalineLuisenhall.svg 628 × 1,003; 42 KB
-
 Vergaserkraftwerk.svg 961 × 515; 155 KB
-
 Water fuel cell circuit.png 913 × 552; 79 KB
-
 Water System Validation Process Flow.jpg 953 × 646; 156 KB
-
 Well test separator.svg 1,500 × 1,000; 40 KB
-
 XMOOC-Learning-Process.jpg 1,207 × 460; 103 KB
-

-
 常圧蒸留(ブロックダイアグラム) J.PNG 1,000 × 720; 88 KB


.svg)


.png)


.svg)


_elegy_folyamatos_frakcion%C3%A1ldesztill%C3%A1ci%C3%B3ja_hu.PNG)


.svg)
.svg)
-mr.svg)
.svg)


_production_from_suspension_polymerization.svg)


.svg)


.png)
.png)


_J.PNG)
.svg)