Category:Science of tropical cyclones
Jump to navigation
Jump to search
Wikimedia category | |||||
| Upload media | |||||
| Instance of | |||||
|---|---|---|---|---|---|
| |||||
English: These articles cover the meteorology (physical principles, phenomenology, science and prediction) of tropical cyclones. There is a closely related category describing notable cyclones category:tropical cyclones.
Subcategories
This category has the following 17 subcategories, out of 17 total.
A
- Accumulated Cyclone Energy (18 F)
C
- Tropical cyclone charts (68 F)
D
- Dropsondes (10 F)
- Dvorak technique (15 F)
N
- Tropical cyclones naming (6 F)
P
- Power Dissipation Index (2 F)
S
- Tropical cyclone simulation (1 F)
- Storm surge diagrams (41 F)
- Structure of tropical cyclones (57 F)
T
- Tropical cyclone breakpoint maps (14 F)
- Tropical cyclone wind histories (65 F)
W
- Tropical waves (13 F)
Media in category "Science of tropical cyclones"
The following 32 files are in this category, out of 32 total.
-

-
 An observational study of tropical cyclone spin-up in Supertyphoon Jangmi and Hurricane Georges (IA anobservationals1094510686).pdf 1,275 × 1,650, 188 pages; 5.65 MB
-
 Assessment of tropical cyclone structure variability (IA assessmentoftrop1094537723).pdf 1,275 × 1,650, 312 pages; 9.39 MB
-
 Auguststreamlinesnavy.jpg 900 × 473; 142 KB
-

-
Bermuda High.webm 21 s, 720 × 480; 11.8 MB
-
Building a Hurricane Season in the Atlantic Ocean.webm 3 min 6 s, 1,920 × 1,080; 116.15 MB
-
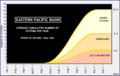 East pacific tc climatology.png 1,112 × 702; 17 KB
-
 Februarystreamlinesnavy.jpg 900 × 473; 145 KB
-
 Hebert boxes.jpg 780 × 507; 254 KB
-
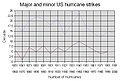 Hurricane strikes on US.JPG 554 × 373; 41 KB
-
 LaNature1873-318-MarcheDUnavireEvitantUnCyclone.png 408 × 276; 5 KB
-
 Mean sst equatorial pacific.gif 432 × 645; 24 KB
-
 Observational-numerical study of the upper ocean response to hurricanes. (IA observationalnum00shay).pdf 1,422 × 1,879, 166 pages; 7.71 MB
-
 The role of vortex structure in tropical cyclone motion. (IA roleofvortexstru00fior).pdf 1,222 × 1,583, 382 pages; 15.41 MB
-
 Hurricane Bob Sea Surface Temperature Difference.jpg 500 × 600; 55 KB
-
 Post Hurricane Bob Sea Surface Temperature.jpg 500 × 600; 36 KB
-
 Pre-Hurricane Bob Sea Surface Temperature.jpg 500 × 600; 38 KB
-
 Sstanom 199711 krig.jpg 350 × 219; 19 KB
-
 Strikezone.png 600 × 500; 9 KB
-
 Subtropical Indian Ocean Dipole.jpg 900 × 1,097; 430 KB
-
 SWWA composite.jpg 852 × 1,029; 685 KB
-
The Brown Ocean Effect.webm 1 min 21 s, 1,920 × 1,080; 317.32 MB
-
-
 Tropical instability waves example.jpg 640 × 480; 81 KB
-
 Hurricane Bob Ocean Turbidity Difference.jpg 500 × 600; 58 KB
-
 Post-Hurricane Bob Ocean Turbidity.jpg 500 × 600; 45 KB
-
 Pre-Hurricane Bob Ocean Turbidity.jpg 500 × 600; 50 KB
-
 Typhoonsizes ru.jpg 288 × 180; 13 KB
-
 Typhoonsizes. ua.png 281 × 179; 51 KB
-
 Typhoonsizes.jpg 288 × 180; 10 KB
-
 Western Hemisphere Warm Pool.JPG 540 × 720; 113 KB


