Category:Scilab
Jump to navigation
Jump to search
Free and open source software for numerical computation  Skjermbilete av Scilab. | |||||
| Upload media | |||||
| Instance of | |||||
|---|---|---|---|---|---|
| Copyright license |
| ||||
| Developer |
| ||||
| Operating system | |||||
| Software version identifier |
| ||||
| official website | |||||
| |||||
Subcategories
This category has the following 3 subcategories, out of 3 total.
Media in category "Scilab"
The following 110 files are in this category, out of 110 total.
-
 1d choisi parmi 2 differents depasser score.png 610 × 461; 6 KB
-
 1d choisi parmi 2 differents.png 610 × 461; 7 KB
-
 1d choisi parmi 3 differents.png 610 × 461; 6 KB
-
 2d6 choisis parmi n.png 581 × 673; 9 KB
-
 2d6 choisis parmi n.svg 503 × 666; 67 KB
-
 3d6 et 3 meillleurs de 4d6.png 610 × 461; 6 KB
-
 Abaque wulff 2 degres.pdf 1,275 × 1,650; 272 KB
-
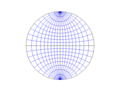
 Abaque wulff graduated.svg 930 × 920; 16 KB
-
 Abaque wulff.png 610 × 461; 8 KB
-
 Abaque wulff.svg 902 × 902; 4 KB
-
 Atoms.png 804 × 603; 30 KB
-
 Atomsscilab532.png 804 × 603; 27 KB
-
 Ayuda de Scilab.png 1,111 × 836; 50 KB
-
 Balayage entrelace signal bobines 1 periode.png 1,024 × 684; 8 KB
-
 Balayage entrelace signal bobines debut.png 1,024 × 684; 8 KB
-
 Balayage entrelace signal bobines fin.png 1,024 × 684; 9 KB
-
 Battements interferentiels spaciaux.png 610 × 461; 8 KB
-
 Battements interferentiels.png 610 × 461; 8 KB
-
 Bezier-spline-3d.png 877 × 589; 29 KB
-
 Courbe polaire rayon aleatoire scilab.svg 610 × 460; 52 KB
-
 Curvasdenivelscilab.jpg 612 × 462; 27 KB
-
 Detection pic derivee seconde.png 610 × 461; 6 KB
-
 Diagramme qq scilab stixbox.svg 610 × 460; 29 KB
-
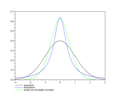
 Difference voigt pseudo-voigt.png 610 × 461; 4 KB
-
 Diffractogramme bruit et fourier.png 610 × 461; 6 KB
-
 Découvrir Scilab-fr.pdf 1,239 × 1,754, 160 pages; 1.1 MB
-
 Escilab.png 650 × 550; 16 KB
-
 Exemple scilab sin cos.gif 616 × 465; 5 KB
-
 Fentes de young profil intensite.png 610 × 461; 3 KB
-
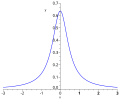
 Fonction lorentzienne.png 610 × 461; 4 KB
-
 Fonction lorentzienne.svg 480 × 400; 34 KB
-
 Fonction voigt.png 610 × 461; 5 KB
-
 Fonctions pseudo-voigt.png 610 × 461; 5 KB
-
 Grae2cnivel1.png 612 × 462; 26 KB
-
 Grafdatosexp.png 612 × 462; 7 KB
-
 Graft-x1.png 612 × 462; 4 KB
-
 Graftp1curva.png 612 × 462; 12 KB
-
 Graphique polynome 1 3 1.png 610 × 461; 3 KB
-
 Helice courbe 3d.png 596 × 397; 4 KB
-
 HelpScilab5.3.3.png 1,111 × 836; 41 KB
-
 Horner.png 848 × 622; 37 KB
-
 Hypothese continuite 20.svg 610 × 460; 28 KB
-
 Integrale double partie decimale de x.png 610 × 461; 4 KB
-
 Integrale double partie entiere.png 610 × 461; 3 KB
-
 Integrale double signal carre.png 610 × 461; 4 KB
-
 Jet sans limite depasser.png 610 × 461; 3 KB
-
 Jet sans limite valeur.png 610 × 461; 4 KB
-
 Legendre polaire y1 y2 y3.png 610 × 461; 11 KB
-
 Limite elastique fct temperature acier appareil pression.svg 463 × 317; 25 KB
-
 Meshgridscilab.jpg 612 × 462; 52 KB
-
 Minimum fonction scilab.svg 610 × 460; 58 KB
-
 Moire densite gris.png 459 × 346; 4 KB
-
 Onde cisaillement impulsion 1d 30.gif 610 × 461; 433 KB
-
 Onde compression impulsion 1d 30.gif 610 × 461; 118 KB
-
 Onde endroit fixe.png 610 × 461; 4 KB
-
 Onde progressive instant donne.png 610 × 461; 8 KB
-
 Ondes cisaillement 2d 20.gif 610 × 461; 528 KB
-
 Ondes compression 2d 20.gif 610 × 461; 432 KB
-
 Ondes P et S 1d 30.gif 610 × 461; 429 KB
-
 Ondes P et S 2d 30.gif 305 × 231; 866 KB
-
 Point inflexion arctan.png 610 × 461; 3 KB
-
 Position hypocentre selon delais arrivee onde 2 stations.png 610 × 461; 5 KB
-
Progression continue octave do3 do4.ogg 4.8 s; 8 KB
-
 Respuestaaunescalon.png 612 × 462; 4 KB
-
-
 Savitzky-golay pic gaussien bruite points aberrants norme l1.svg 486 × 366; 67 KB
-
 Savitzky-golay pic gaussien bruite points aberrants.svg 486 × 366; 67 KB
-
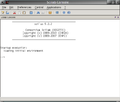
 Scilab 2.0 Screenshot.jpg 500 × 383; 167 KB
-
 Scilab 6 1.png 1,366 × 728; 113 KB
-
 Scilab Bode Plot.png 722 × 668; 53 KB
-
 Scilab curvasnivel.PNG 1,280 × 704; 42 KB
-
 Scilab development.pdf 1,650 × 1,275; 531 KB
-
 Scilab en.png 1,024 × 768; 73 KB
-
 Scilab exemple 3d 2.png 548 × 461; 15 KB
-
 Scilab exemple 3d.png 523 × 461; 10 KB
-
 Scilab Logo.png 345 × 173; 7 KB
-
 Scilab Nyquist Plot Example.png 610 × 460; 10 KB
-
 Scilab plot.png 618 × 535; 20 KB
-
 Scilab plot2d avec symboles et legendes.png 610 × 461; 5 KB
-
 Scilab plot2d.png 610 × 461; 5 KB
-
 SciLab Step Respone Plot.png 722 × 668; 48 KB
-
 Scilab5.3.3-scinotes.png 1,124 × 572; 26 KB
-
 Scilab532enslack.png 650 × 550; 16 KB
-
 SciNotesScilab-5.3.3.png 650 × 550; 16 KB
-
 Screenshot scilab 3.png 1,162 × 890; 103 KB
-
 Senox.jpg 612 × 460; 40 KB
-
 Signal bruit et fourier.png 610 × 461; 8 KB
-
 Signal bruite cumule.png 610 × 461; 6 KB
-
 Signal gaussien.png 610 × 461; 6 KB
-
 Sine with partial backgrounds.png 503 × 331; 9 KB
-
 Statistiques IDH 2000.png 610 × 461; 3 KB
-
 Statistiques IPH 2000.png 610 × 461; 4 KB
-
 Surface position hypocentre 2 stations.png 610 × 461; 23 KB
-
 Trochoide rapport 10.svg 488 × 365; 33 KB
-
 Uicontrol xcarre scilab.png 620 × 590; 18 KB
-
 Vibration corde fondamentale trois longueurs petit.gif 305 × 231; 67 KB
-
 Vibration corde fondamentale trois longueurs.gif 610 × 461; 95 KB
-
 Vibration corde trois harmoniques combinees petit.gif 305 × 231; 80 KB
-
 Vibration corde trois harmoniques combinees.gif 610 × 461; 99 KB
-
 Vibration corde trois modes petit.gif 305 × 231; 76 KB
-
 Vibration corde trois modes.gif 610 × 461; 137 KB
-
 Von koch 1 etape.svg 600 × 175; 485 bytes
-
 Von koch 2 etapes.svg 600 × 175; 691 bytes
-
 Von koch 3 etapes.svg 600 × 175; 923 bytes
-
 Von koch 4 etapes.svg 600 × 175; 1 KB
-
 Von koch 5 etapes.svg 600 × 174; 1 KB
-
 Von koch 6 etapes.svg 600 × 174; 2 KB
-
 W3scilab.png 938 × 496; 54 KB
-
 W3scilab1.png 855 × 482; 168 KB
-
 X sin 1 sur x.png 610 × 461; 5 KB


