Category:Statistical inference
Jump to navigation
Jump to search
process of deducing properties of an underlying probability distribution by analysis of data | |||||
| Upload media | |||||
| Subclass of | |||||
|---|---|---|---|---|---|
| Different from | |||||
| |||||
Subcategories
This category has the following 5 subcategories, out of 5 total.
Media in category "Statistical inference"
The following 54 files are in this category, out of 54 total.
-
 01fig-inference.png 412 × 294; 58 KB
-
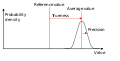 Accuracy (trueness and precision).svg 550 × 280; 9 KB
-
 Accuracy and precision (hu).png 602 × 366; 18 KB
-
 Accuracy and precision example.jpg 248 × 945; 26 KB
-
 Accuracy and precision sl.svg 540 × 280; 8 KB
-
 Accuracy and precision tr.svg 520 × 280; 12 KB
-
 Accuracy and precision uk.svg 550 × 280; 8 KB
-
 Accuracy and precision-ar.svg 393 × 234; 77 KB
-
 Accuracy and precision.svg 520 × 280; 8 KB
-
 Accuracy-vs-precision-nl.svg 512 × 130; 39 KB
-
 Bayes estimation example.svg 630 × 630; 28 KB
-
 Bootstrap.gif 468 × 314; 432 KB
-
 CD-Inference.png 948 × 729; 50 KB
-
 Chisquarenomo3.png 451 × 661; 76 KB
-
 ConsistentEstimationFunction.png 700 × 700; 9 KB
-
 Cramer-Rao bound illustration variance.jpg 1,280 × 720; 47 KB
-
 Distribution of mean estimator.svg 630 × 630; 103 KB
-
 Exactitud y precision.png 520 × 280; 12 KB
-
 Exactitud y precisión 02.svg 520 × 280; 7 KB
-
 Exactitud y precisión.svg 520 × 280; 7 KB
-
 Example when estimator bias is good.svg 180 × 121; 6 KB
-
 Feature selection Embedded Method uk.png 814 × 335; 17 KB
-
 Feature selection Wrapper Method uk.png 915 × 359; 17 KB
-
 German tank problem.pdf 1,239 × 1,754; 35 KB
-
 Heartrate.jpg 560 × 420; 30 KB
-
 High accuracy Low precision.svg 300 × 300; 3 KB
-
 Id sampel (statistik).JPG 512 × 329; 15 KB
-
 K Candidate Diagram.png 244 × 249; 5 KB
-
 Margem-de-erro.gif 590 × 310; 521 KB
-
 Margin of error vs sample size and confidence level.svg 512 × 384; 11 KB
-
 Margin-of-error-95.svg 575 × 469; 14 KB
-
-
 Marginoferror95.PNG 1,029 × 973; 48 KB
-
 MarginoferrorViz.png 900 × 831; 42 KB
-
 Modelo frecuentista 1.jpg 566 × 425; 8 KB
-
 Modelo frecuentista 10.jpg 566 × 425; 13 KB
-
 Modelo frecuentista 2.jpg 566 × 425; 19 KB
-
 Modelo frecuentista 3.jpg 566 × 425; 13 KB
-
 Modelo frecuentista 4.jpg 566 × 425; 14 KB
-
 Modelo frecuentista 5.jpg 566 × 425; 14 KB
-
 Modelo frecuentista 6.jpg 566 × 425; 14 KB
-
 Modelo frecuentista 7.jpg 566 × 425; 19 KB
-
 One sample ttest.svg 900 × 180; 31 KB
-
 Origins Of Hybrid Hypothesis Testing.png 500 × 1,467; 336 KB
-
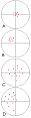
 Precision versus accuracy.svg 1,855 × 1,494; 28 KB
-
 Precision-Accuracy.svg 260 × 1,285; 34 KB
-
 Reliability and validity.svg 2,055 × 2,201; 21 KB
-
 Richtigkeit und Präzision.png 331 × 283; 18 KB
-
 Runstest 001.png 480 × 480; 3 KB
-
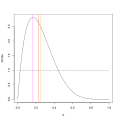
 Spacing Estimation plot for MSE example.png 672 × 672; 11 KB
-
 Spacings.svg 324 × 235; 73 KB
-
 Undergraduate statistical inference.pdf 1,239 × 1,752, 157 pages; 34.45 MB
-
 Viterbi animated demo.gif 500 × 268; 139 KB
-
 ZentralesSchwankungsintervall.svg 630 × 630; 48 KB

.svg)
.png)


.JPG)


