Category:Thermodynamic diagrams
Перейти до навігації
Перейти до пошуку
графік, на якому на осях системи декартових координат відкладають значення термодинамічних параметрів або однозначно пов'язаних з ними функцій стану | |||||
| Завантажити медіафайл | |||||
| Є підкласом | |||||
|---|---|---|---|---|---|
| |||||
Thermodynamic diagrams are diagrams used by scientists and engineers to represent the thermodynamic states of a material (typically fluid) and the consequences of manipulating this material.
Підкатегорії
Показано 32 підкатегорії з 32.
A
- Amagat diagram (3 F)
C
- Compressibility factor (15 F)
E
- Ellingham diagram (4 F)
- Enthalpy diagrams (31 F)
- Enthalpy-entropy diagrams (24 F)
H
- H-x diagrams (19 F)
- Heat pump diagrams (65 F)
L
- Latimer diagrams (5 F)
M
- Mixing properties (4 F)
P
Q
- Q-T diagrams (7 F)
R
- Regenerative Rankine Cycle (18 F)
- Reheated Rankine Cycle (10 F)
S
- Sorption isotherms (18 F)
- Thermodynamic surfaces (3 F)
T
- Temperature-entropy diagrams (104 F)
- Thermal analysis curves (23 F)
- Thermal comfort (4 F)
- Thermal wind (13 F)
- Thermocouple diagrams (4 F)
U
- UNIFAC (7 F)
V
Файли в категорії «Thermodynamic diagrams»
Показано 193 файли цієї категорії (із 193).
-
 Ads isothermen.svg 744 × 531; 23 КБ
-
 Adsiso1.svg 621 × 610; 20 КБ
-
 Adsiso2.svg 647 × 604; 20 КБ
-
 Agua temperatura por calor.svg 512 × 410; 12 КБ
-
 AircraftCompressorDischargeTemperatureVSAltitude.jpg 1385 × 1068; 233 КБ
-
 Anomuladaagua-califos.png 619 × 543; 7 КБ
-
 Assimilation of Hot and Cold Particles.png 640 × 480; 24 КБ
-
 Asymetryczna przemiana fazy R.JPG 619 × 890; 56 КБ
-
 Bell Evans Polanyi Prinzip.svg 585 × 620; 21 КБ
-
 Boucle.jpg 762 × 663; 62 КБ
-
 Boudouard graph german.png 502 × 382; 563 КБ
-
 Burn Rate vs Pressure.png 1157 × 675; 13 КБ
-
 BurnRate.png 1157 × 675; 14 КБ
-
 By me 14.03.2010.PNG 349 × 221; 18 КБ
-
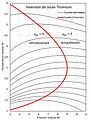
 Can T=0 be reached.jpg 2876 × 1636; 592 КБ
-
 Co-h20-g-h.svg 600 × 480; 7 КБ
-
 Concorde - airframe temperatures.svg 634 × 284; 27 КБ
-
 Constant volume flame temperature (chart for multiple fuels).jpg 467 × 456; 238 КБ
-
 Contact conductance.png 295 × 254; 16 КБ
-
 Contact conductance.svg 396 × 359; 44 КБ
-
 Cooling mixed fluids.png 1146 × 792; 37 КБ
-
 CoolingLoadUFADvsOH.png 442 × 138; 32 КБ
-
 Cp wzgl T.svg 743 × 646; 77 КБ
-
 Cpmcv.png 387 × 327; 19 КБ
-
 Curva de ebullicion.svg 764 × 855; 88 КБ
-
 DeltaH for Boudouard Reaction by Temperature.png 445 × 278; 11 КБ
-
 Densite eau.svg 900 × 540; 37 КБ
-
 DePriester Chart 1.JPG 571 × 749; 66 КБ
-
 DePriester Chart 2.JPG 550 × 676; 67 КБ
-
 DHT-calculations.svg 2093 × 1541; 105 КБ
-
 Diagramme d'inflammabilité.JPG 3240 × 4320; 4,83 МБ
-
 Diagramme pvt polymere schematique.svg 213 × 111; 21 КБ
-
 Distances verticales.svg 520 × 250; 326 КБ
-
 Dobor zbiornika do sprezarek.png 582 × 496; 22 КБ
-
 DUDS.jpg 234 × 234; 16 КБ
-
 Dynamic equilibrium.png 305 × 249; 2 КБ
-
 Détente Joule.jpeg 399 × 103; 4 КБ
-
 Eau-acide acétique - volume de mélange - méthode de Roozeboom.jpg 976 × 638; 109 КБ
-
 Eau-acide acétique - volume de mélange.jpg 978 × 640; 77 КБ
-
 Eau-acide acétique - volume et volume idéal.jpg 978 × 640; 78 КБ
-

-
 Elektrischer Wirkungsgrad.png 800 × 543; 74 КБ
-
 Enthalpie libre mélange binaire 2 phases.jpg 773 × 507; 37 КБ
-
 Equilibrio quimico e catalise.png 222 × 184; 6 КБ
-
 Es14p57.png 960 × 720; 14 КБ
-
 Es14p57c.png 787 × 618; 17 КБ
-
 Escalas de Temperatura.jpg 300 × 294; 15 КБ
-
 Et fig2-pt.png 2222 × 2103; 138 КБ
-
 Et fig2.png 527 × 505; 4 КБ
-
 EthyleneGlycolMixturesDryIceBath.png 1462 × 1401; 39 КБ
-
 Example Circuit Thermique - Electrique.png 816 × 404; 31 КБ
-
 Example of Consistent Specification of Diffusive fluxes.jpg 1440 × 485; 54 КБ
-
 Exergie von Wasserdampf.jpg 813 × 621; 108 КБ
-
 Explosionsgrenzen Knallgasreaktion.svg 429 × 407; 92 КБ
-
 Flux gv52.png 523 × 285; 12 КБ
-
 Fluxo de calor correto.jpg 374 × 272; 14 КБ
-
 FocoFrioCaliente.png 720 × 975; 144 КБ
-
 FrenkelFig3Custom.PNG 378 × 291; 19 КБ
-
 FspFkt 100dpi de.png 760 × 760; 23 КБ
-
 FspFkt 100dpi en.png 760 × 760; 23 КБ
-
 Gas thermometer and absolute zero fr.jpg 1114 × 608; 87 КБ
-
 Gas thermometer and absolute zero.jpg 1114 × 608; 91 КБ
-
 Gastoliq.gif 460 × 350; 6 КБ
-
 Gd Heat Capacity DE.svg 720 × 540; 17 КБ
-
 GestStrC.png 959 × 918; 90 КБ
-
 Gibbs (1).jpg 454 × 312; 34 КБ
-
 Gota flutuando - efeito Leidenfrost.png 800 × 589; 64 КБ
-
 Grafico-dioxinas.jpg 411 × 307; 40 КБ
-
 GraficoH2S.jpg 411 × 284; 29 КБ
-
 GrafSO2BIONATUR.jpg 411 × 284; 55 КБ
-
 GrafSO2Comercial.jpg 411 × 284; 48 КБ
-
 Graph1.jpg 442 × 249; 7 КБ
-
 GraphofHPWReaction.jpg 518 × 430; 23 КБ
-
 Hard-sphere phase diagram pressure packing fraction.svg 476 × 425; 59 КБ
-
 Heat absorbed and realeased of water.png 1468 × 785; 749 КБ
-
 Heat-capacity-transition.png 430 × 105; 6 КБ
-
 Heat-capacity-transition.svg 500 × 135; 5 КБ
-
 Heavy vs light weight school classroom.JPG 700 × 476; 44 КБ
-
 Hessov zakon 01.jpg 357 × 167; 9 КБ
-
 Homomorphoteleo.jpg 1057 × 618; 173 КБ
-
 Insetropic,polytropic,isothermal.jpg 500 × 500; 20 КБ
-
 Instableair.svg 600 × 520; 21 КБ
-
 Interferenze.JPG 642 × 384; 20 КБ
-
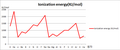 Ionization energy.PNG 705 × 292; 14 КБ
-
 Isobare Molare Wärmekapazität (Aceton).png 500 × 500; 16 КБ
-
 James Clerk Maxwell - Thermodynamic surface figure from book.jpg 1078 × 1620; 148 КБ
-
 JobackNormalsiedepunktSystematischerFehler.png 650 × 492; 41 КБ
-
 JODDADRU Jod Dampfdruck.PNG 508 × 381; 18 КБ
-
 Joule-Thomson - van der Waals.jpg 420 × 560; 52 КБ
-
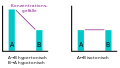 Konzentrationsgefälle.svg 695 × 395; 6 КБ
-
 Kramers escape rate.svg 751 × 507; 29 КБ
-
 Krzywa złożona.jpg 722 × 425; 40 КБ
-
 Krzywe cieplne układu wymienników.jpg 683 × 537; 48 КБ
-
 Kw vs I.png 303 × 231; 2 КБ
-
 Lambda transition.svg 531 × 390; 62 КБ
-
 Langmuir adsorpsjonsisotermen.jpg 1213 × 703; 78 КБ
-
 Leeres Diagramm01.png 1683 × 1190; 25 КБ
-
 Lei das Temperaturas Sucessivas.jpg 483 × 212; 27 КБ
-
 Lilpscomb-ethane-barrier.png 1000 × 806; 44 КБ
-
 Limonene water vapor.svg 632 × 626; 27 КБ
-
 Liquid model.svg 144 × 175; 33 КБ
-
 LOCA2.png 1225 × 962; 84 КБ
-
 Logm.jpg 1011 × 1463; 36 КБ
-
 Loicharles2.jpg 333 × 327; 11 КБ
-
 Machine-thermoacoustique.png 1238 × 665; 178 КБ
-
 Machines thermiques fondamentales.svg 1691 × 777; 36 КБ
-
 Macro-level-water copy.png 1624 × 436; 49 КБ
-
 Made by me 14.03.2010.PNG 494 × 309; 4 КБ
-
 Massenstromdichte als Funktion des Austrittsdruckes.jpg 1391 × 1052; 127 КБ
-
 Maxwell's letters plate IV.jpg 418 × 539; 96 КБ
-
 Micro constants.png 796 × 480; 4 КБ
-
 MInd mapping - Heat.jpg 3508 × 4961; 3,03 МБ
-
 Mischung feuchter Luftmengen.jpg 527 × 421; 103 КБ
-
 MixtureSurfaceTensionPropionic acid+Water.png 388 × 477; 18 КБ
-
 MM pv plane 01.png 906 × 810; 67 КБ
-
 MM pv plane 02.svg 1280 × 720; 101 КБ
-
 MM pv plane 03.png 901 × 815; 67 КБ
-
 Mmpbsa cycle.png 1777 × 1074; 266 КБ
-
 Molecular-collisions fr.jpg 731 × 243; 34 КБ
-
 Monikaru chemistryHW 1.jpg 711 × 346; 142 КБ
-
 MOSCEDDerviations.png 1010 × 849; 96 КБ
-
 Méthode de Roozeboom.jpg 819 × 516; 47 КБ
-
 Nebelbildung durch Mischen.jpg 443 × 332; 82 КБ
-
 NiGly titration.jpg 372 × 434; 34 КБ
-
 NTCtermistoro.jpg 276 × 151; 4 КБ
-
 Nulte lov.PNG 694 × 400; 14 КБ
-
 Osmosis hydraulic pressure-af.svg 1052 × 744; 34 КБ
-
 P Benzol+Toluol 3.svg 536 × 507; 20 КБ
-
 P Chloroform+Aceton4.svg 552 × 602; 22 КБ
-
 P constant.png 159 × 110; 3 КБ
-
 P idem Ts.png 654 × 583; 15 КБ
-
 Partition coeff1.svg 4777 × 6492; 1,77 МБ
-
 Partition coeff2.svg 4894 × 6580; 445 КБ
-
 PCKlincewicz.png 465 × 407; 10 КБ
-
 Pote de água 5.png 216 × 209; 10 КБ
-
 Pro Chem Isotherm Adiabatic Sketch.gif 207 × 280; 1 КБ
-
 PSRK VLE Prediction Cyclohexane and Carbon Dioxide.png 512 × 483; 19 КБ
-
 Puntoiso.jpg 741 × 372; 16 КБ
-

-
 R-134a phdia a3 rp.svg 1260 × 900; 525 КБ
-
 Racines d'une équation d'état cubique.jpg 879 × 569; 74 КБ
-
 Reacao de equilibrio (velocidade).png 238 × 184; 6 КБ
-
 Relation Zéro absolu, Chaleur, Agitation des particules 1-fr.jpg 710 × 647; 71 КБ
-
 Relation Zéro absolu, Chaleur, Agitation des particules-fr.jpg 710 × 647; 72 КБ
-
 ResidueCurvesNodeClassification.png 1059 × 669; 86 КБ
-
 RubberElRevFig1.png 630 × 338; 25 КБ
-
 Schallgeschwindigkeit von Ethylen bei 100°C als Funktion des Druckes.jpg 1125 × 849; 59 КБ
-
 Schema kompresoroveho chlazeni.png 747 × 426; 14 КБ
-
 SFT-Benzol.png 388 × 342; 9 КБ
-
 Simon-Glatzel equation.png 507 × 445; 24 КБ
-
 SolidEOS.jpg 532 × 370; 37 КБ
-
 Solubilità diretta e inversa.svg 700 × 900; 106 КБ
-
 Steam Generator.svg 765 × 515; 23 КБ
-
 Steam-turbines.JPG 646 × 427; 83 КБ
-
 Student steam table saturation P(T).png 2419 × 1806; 30 КБ
-
 Student steam table saturation v,u,h,s.png 8138 × 3662; 178 КБ
-
 Symetryczna przemiana fazy R.JPG 247 × 351; 36 КБ
-
 T constant.png 167 × 145; 3 КБ
-
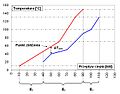
 T-rosée=f(%CO2).png 4441 × 4617; 2,08 МБ
-
 Tar elim Nut 05.gif 452 × 574; 26 КБ
-
 TCKlincewicz.png 465 × 407; 10 КБ
-
 Techn Arbeit Volumenarbeit 2.jpg 608 × 443; 32 КБ
-
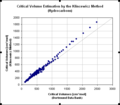
 Temperature-relative humidity chart - PMV method.pdf 622 × 527; 105 КБ
-
 Thermal mass flow meter(constant temperature differential).png 519 × 300; 66 КБ
-
 Thermodynamic stability EN.svg 400 × 250; 12 КБ
-
 Thermodynamic stability NL.svg 400 × 250; 12 КБ
-
 Thermodynamik.jpg 1903 × 1207; 144 КБ
-
 Thermodynamik1.jpg 3834 × 1384; 421 КБ
-
 Thermodynamische condenspot.PNG 426 × 296; 11 КБ
-
 Three 2 spheres in 3D space.GIF 528 × 456; 42 КБ
-
 TO92.jpg 294 × 194; 14 КБ
-
 Transformations polytropiques.jpg 633 × 527; 48 КБ
-
 Tsirlin-boiler-scheme.pdf 395 × 354; 5 КБ
-
 UNIQUACRegressionAktivitaetskoeffizientenChloroformMethanol.png 553 × 620; 46 КБ
-
 UNIQUACRegressionChloroformMethanol.png 553 × 620; 45 КБ
-
 Vanderwaals2.jpg 2339 × 1653; 101 КБ
-
 VaporPressureFitAntoine.png 585 × 448; 20 КБ
-
 VaporPressureFitDIPPR101.png 585 × 448; 20 КБ
-
 VCKlincewicz.png 465 × 407; 9 КБ
-
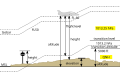 Vertical distances.svg 463 × 283; 337 КБ
-
 Vista nocturna del casco histórico de Peñíscola.jpg.jpg 2886 × 2008; 2,2 МБ
-
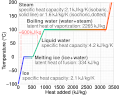 Water temperature vs heat added.svg 512 × 410; 5 КБ
-
 WaterStab.png 279 × 229; 2 КБ
-
 Waterworks.png 378 × 420; 17 КБ
-
 Wirkungsgrad Gaskraftmaschinen.gif 800 × 543; 51 КБ
-
 Workdistribution.png 1000 × 533; 28 КБ
-
 Wykres Gibbsa.svg 695 × 800; 12 КБ
-
 Wykresy cieplne wymiennków ciepła.jpg 783 × 428; 43 КБ
-
 Wymiennik ciepła wykres cieplny.jpg 758 × 607; 62 КБ
-
 Wärme-Exergie.jpg 1031 × 647; 276 КБ
-
 Wärmeübertragungsdiagramm.jpg 903 × 1129; 241 КБ
-
 XY SpecificHeat.svg 450 × 425; 102 КБ
-
 Тепловое скольжение.jpg 253 × 160; 8 КБ


.jpg)


.jpg)


.png)


.png)


.png)


.png)


.png)


