Category:Transport bar charts
Jump to navigation
Jump to search
Bar charts about transport.
Media in category "Transport bar charts"
The following 29 files are in this category, out of 29 total.
-
75 Prozent Streckenelektrifizierung bis 2030.png 1,600 × 901; 113 KB
-
Allocation of Space for Transport Infrastructure - Example of Berlin.png 4,267 × 4,268; 343 KB
-
Annual traffic deaths by age Netherlands 1950-2020.png 1,281 × 833; 82 KB
-
Anteil elektrifizierter Strecken im staatlichen Eisenbahnnetz.png 1,600 × 901; 52 KB
-
Corridor Capacity.png 4,329 × 2,800; 189 KB
-
EffizienzLeistungFahrzeuge.png 1,198 × 855; 80 KB
-
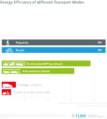
Energy Efficiency of different Transport Modes.png 3,724 × 4,159; 250 KB
-
Graph of emissions by city.jpg 600 × 627; 46 KB
-
Health Impacts of Automobility.png 3,782 × 4,159; 340 KB
-
Livraisons de Boeing 747 par variante depuis 1969.svg 600 × 400; 60 KB
-
Livraisons de Boeing 777 par variante depuis 1995.svg 600 × 400; 66 KB
-
Melbourne metropolitan public transport patronage from 1994.png 558 × 370; 35 KB
-
Movements Hilversum Airport.png 2,805 × 993; 191 KB
-
Participación del sector transporte en el PIB.jpg 3,024 × 4,032; 6.69 MB
-
Passenger Capacity of different Transport Modes.png 3,722 × 4,159; 457 KB
-
Road Space Requirements.png 3,717 × 4,182; 308 KB
-
Road-way vs. railway safety.png 3,337 × 2,538; 348 KB
-
Street Traffic and Social Interaction.png 3,752 × 4,158; 576 KB
-
The Car-free Spectrum.png 3,812 × 4,159; 246 KB
-
Transportation pollution.svg 744 × 524; 18 KB
-
Transports600 (English).svg 793 × 1,811; 1.07 MB
-
Transports600.svg 793 × 1,811; 1.07 MB
-
UK transport modal share from 1952-2014.png 1,075 × 625; 34 KB
-
Valor FOB de las exportaciones.jpg 3,024 × 4,032; 7.66 MB
-
Verkehrstote 1980 und 2010.gif 450 × 325; 5 KB
-
Verwendung der Mautmittel.png 967 × 667; 56 KB
-
WB Logistics performance index 2014.png 3,360 × 1,097; 110 KB


