Category:Trophoblast
Jump to navigation
Jump to search
Subcategories
This category has the following 2 subcategories, out of 2 total.
I
- Intermediate trophoblast (8 F)
T
- Trophectoderm (6 F)
Media in category "Trophoblast"
The following 56 files are in this category, out of 56 total.
-
 2908 Germ Layers-02.jpg 1,781 × 1,590; 1.06 MB
-

-

-
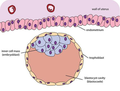 Diagram of Blastocyst stage.png 671 × 509; 329 KB
-
 Didelphidae early development of blastoderm.jpg 1,045 × 788; 621 KB
-
 Differentiation oi Zygote and Cells (Hypothetical).png 565 × 605; 538 KB
-
 Early blastocyst adhesion and invasion in primate and mouse.jpg 1,961 × 810; 312 KB
-

-
 Early human embryo (01).jpg 675 × 563; 209 KB
-
 Early human embryo (02).jpg 915 × 432; 257 KB
-
 Early human embryo.jpg 761 × 738; 272 KB
-
 EmbryonVitellinsecondaire.jpg 1,685 × 2,120; 789 KB
-
 Extraembryonic tissues and organs in a mouse embryo and foetus.jpg 1,200 × 581; 542 KB
-
 Extraembryonic tissues during amniote development.jpg 1,456 × 1,398; 1.97 MB
-

-
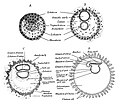 Four diagrams showing hypothetical stages of early human embryos.jpg 1,631 × 1,434; 943 KB
-
 Further Differentiation of Zygote (Hypothetical).png 552 × 445; 422 KB
-
 Generation and analysis of a combined human sequencing dataset. Human embryo.png 2,168 × 2,153; 2.36 MB
-
 Gray32.png 500 × 417; 53 KB
-
 Implantation depth in primates at lacunar stage.jpg 1,985 × 2,656; 1.13 MB
-

-

-

-

-

-

-

-

-
Polar trophectoderm expansion 1.ogv 35 s, 304 × 321; 950 KB
-
Polar trophectoderm expansion. Mouse.ogv 45 s, 512 × 512; 2.88 MB
-
 PSM V84 D538 Facts and factors of development fig14.jpg 789 × 767; 101 KB
-

-
 Schema of Differentiation of Zygote (Bryce's Ovum).png 768 × 584; 772 KB
-
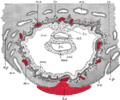
 Schema of Differentiation of Zygote (Peter's Ovum).png 864 × 777; 1.1 MB
-
 Schema of Dorsal Aspect of Embkyo, showing partial closure of neural groove.png 1,067 × 956; 1.21 MB
-

-
 Schema of Sagittal Section of Zygote along Line A in Fig. 31.png 1,166 × 816; 1.34 MB
-
 Schema of Transverse Section of Zygote along Line B in Fig. 31.png 1,195 × 833; 1.34 MB
-
 Schema of Transverse Section of Zygote along Line C in Fig. 31.png 1,171 × 845; 1.36 MB
-

-
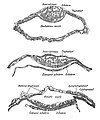 Section showing three stages in the formation of the amnion of bat embryo.jpg 1,407 × 1,695; 911 KB
-
 Simiiformes developing blastocyst.jpg 1,105 × 1,369; 668 KB
-
 Spectrum of pluripotency in the human embryo.jpg 1,950 × 1,006; 324 KB
-
 Spectrum of pluripotency in the mouse embryo.jpg 1,959 × 838; 904 KB
-
 Stages of mammals embryos.jpg 976 × 1,102; 849 KB
-

-
 Summary of strategies used for blastoid formation in mouse and human.jpg 1,088 × 952; 698 KB
-
 Sus domesticus blastocyst.jpg 1,016 × 759; 647 KB
-
TE cell flow during pre-implantation development. Mouse.ogv 24 s, 666 × 648; 1,016 KB
-

-

-

-

-
Trophectoderm cell flow stops upon embryo implantation 1.ogv 11 s, 538 × 606; 671 KB
-
Trophectoderm cell flow stops upon embryo implantation. Mouse.ogv 7.6 s, 596 × 742; 679 KB
-
Trophectoderm tissue boundary forms during embryo implantation Mouse 2.ogv 8.0 s, 277 × 305; 510 KB


.png)

_relate_the_trophoblast_(T)_to_the_amnion_and_the_secondary_yolk_sac_(YS).png)
.jpg)
.jpg)


.png)


.jpg)
.jpg)

.png)
.png)


