Category:United States House of Representatives election maps by states (set)
Jump to navigation
Jump to search
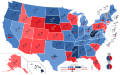
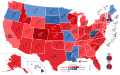
These sets of maps illustrate each US House of Representatives election results by state. The states' color shades illustrate the voting strength of the parties with the plurality in popular votes (with 5% intervals). Overlaying bar charts demonstrate the seat count the parties won in each state.
Source: https://history.house.gov/Institution/Election-Statistics/Election-Statistics/
Note: This is an ongoing project. You are welcome in contributing more.
Media in category "United States House of Representatives election maps by states (set)"
The following 18 files are in this category, out of 18 total.
-
 1974 US House of Representatives Election by States.svg 512 × 317; 580 KB
-
 1990 US House of Representatives Election by States.svg 512 × 317; 77 KB
-
 1992 US House of Representatives Election by States.svg 512 × 317; 72 KB
-
 1994 US House of Representatives Election by States.svg 512 × 317; 71 KB
-
 1996 US House of Representatives Election by States.svg 512 × 317; 77 KB
-
 1998 US House of Representatives Election by States.svg 512 × 317; 77 KB
-
 2000 US House of Representatives Election by States.svg 512 × 317; 72 KB
-
 2002 US House of Representatives Election by States.svg 512 × 317; 72 KB
-
 2004 US House of Representatives Election by States.svg 512 × 317; 71 KB
-
 2006 US House of Representatives Election by States.svg 512 × 317; 71 KB
-
 2008 US House of Representatives Election by States.svg 512 × 317; 71 KB
-
 2010 US House of Representatives Election by States.svg 512 × 317; 70 KB
-
 2012 US House of Representatives Election by States.svg 512 × 317; 69 KB
-
 2014 US House of Representatives Election by States.svg 512 × 317; 70 KB
-
 2016 US House of Representatives Election by States.svg 512 × 317; 70 KB
-
 2018 US House of Representatives Election by States.svg 512 × 317; 70 KB
-
 2020 US House of Representatives Election by States.svg 512 × 317; 69 KB
-
 2022 US House of Representatives Election by States.svg 512 × 317; 70 KB


