File:2016 United States presidential election results map by county.svg
跳至導覽
跳至搜尋

此 SVG 檔案的 PNG 預覽的大小:555 × 352 像素。 其他解析度:320 × 203 像素 | 640 × 406 像素 | 1,024 × 649 像素 | 1,280 × 812 像素 | 2,560 × 1,624 像素。
原始檔案 (SVG 檔案,表面大小:555 × 352 像素,檔案大小:1.74 MB)
說明
說明
添加單行說明來描述出檔案所代表的內容
| 描述 |
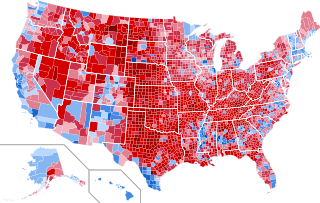
English: Results by county of the United States presidential election, 2016.
Clinton—80-90%
Clinton—70-80%
Clinton—60-70%
Clinton—50-60%
Clinton—40-50%
Clinton—<40%
Trump—<40%
Trump—40-50%
Trump—50-60%
Trump—60-70%
Trump—70-80%
Trump—80-90%
Trump—>90%
|
||||
| 日期 | |||||
| 來源 |
本檔案衍生自: USA Counties.svg |
||||
| 作者 | Ali Zifan 和 Inqvisitor | ||||
| 授權許可 (重用此檔案) |
|
||||
| 其他版本 |
[]
|


.svg)
.svg)


檔案歷史
點選日期/時間以檢視該時間的檔案版本。
| 日期/時間 | 縮圖 | 尺寸 | 用戶 | 備註 | |
|---|---|---|---|---|---|
| 目前 | 2023年3月3日 (五) 23:04 | | 555 × 352(1.74 MB) | Gordfather69(對話 | 貢獻) | line width |
| 2019年12月1日 (日) 05:37 |  | 555 × 352(1.73 MB) | SpeedMcCool(對話 | 貢獻) | Fixed Tazewell County, Illinois | |
| 2019年11月21日 (四) 16:06 |  | 555 × 352(1.73 MB) | SpeedMcCool(對話 | 貢獻) | Updated McCone County Montana | |
| 2019年10月11日 (五) 01:13 |  | 555 × 352(1.73 MB) | SpeedMcCool(對話 | 貢獻) | Fixed Potter and Lehigh Counties PA | |
| 2018年10月27日 (六) 21:50 |  | 555 × 352(1.73 MB) | Vartemp(對話 | 貢獻) | Fixed shading for McDonald County, MO. | |
| 2017年7月29日 (六) 16:16 |  | 555 × 352(1.73 MB) | Inqvisitor(對話 | 貢獻) | Two county shading corrections | |
| 2017年2月15日 (三) 16:41 |  | 555 × 352(1.74 MB) | Jayjay8990(對話 | 貢獻) | Reverted to version as of 05:49, 8 February 2017 (UTC) | |
| 2017年2月15日 (三) 01:50 |  | 990 × 627(983 KB) | Kingofthedead(對話 | 貢獻) | Reverted to version as of 05:41, 8 February 2017 (UTC) I disagree that the borders are too thin, and this map is much larger and clearer | |
| 2017年2月8日 (三) 05:49 |  | 555 × 352(1.74 MB) | TL565(對話 | 貢獻) | Don't you falsely accuse me of sock puppetry! The map should match the previous county maps and yes the borders are way too thin. | |
| 2017年2月8日 (三) 05:41 |  | 990 × 627(983 KB) | Oganesson007(對話 | 貢獻) | @TL565 Please stop reverting the map with the alternative accounts. Also, This map is half of the size of that with optimal border size and more clarification. In this map (unlike the map that you keep putting here) small counties are clearly visible. |
無法覆蓋此檔案。
檔案用途
下列98個頁面有用到此檔案:
- User:Magog the Ogre/Political maps/2016 December 11-20
- User:Magog the Ogre/Political maps/2016 December 21-31
- User:Magog the Ogre/Political maps/2016 March 21-31
- User:Magog the Ogre/Political maps/2016 November 1-10
- User:Magog the Ogre/Political maps/2016 November 21-30
- User:Magog the Ogre/Political maps/2017 February 1-9
- User:Magog the Ogre/Political maps/2017 February 10-18
- User:Magog the Ogre/Political maps/2017 January 1-10
- User:Magog the Ogre/Political maps/2017 July 21-31
- User:Magog the Ogre/Political maps/2018 October 21-31
- User:Magog the Ogre/Political maps/2019 December 1-10
- User:Magog the Ogre/Political maps/2019 November 21-30
- User:Magog the Ogre/Political maps/2019 October 11-20
- User:Magog the Ogre/Political maps/2023 March 1-10
- User:Oganesson007/Contributions
- User:OgreBot/Watercraft/2016 December 11/Overflow 2
- User:OgreBot/Watercraft/2016 December 12
- User:OgreBot/Watercraft/2016 December 14
- User:OgreBot/Watercraft/2016 December 16
- User:OgreBot/Watercraft/2016 December 17
- User:OgreBot/Watercraft/2016 December 19
- User:OgreBot/Watercraft/2016 December 20
- User:OgreBot/Watercraft/2016 December 24
- User:OgreBot/Watercraft/2016 December 25
- User:OgreBot/Watercraft/2016 December 28
- User:OgreBot/Watercraft/2017 January 4
- User talk:Kingofthedead/Archive 3
- User talk:Vartemp
- File:2016 Presidential Election by County.svg
- File:2016 Presidential Election by County (Red-Blue-Purple View).png
- File:2016 Presidential Election by County (Red-Blue-Purple View).svg
- File:2016 Presidential Election by County - Clinton.svg
- File:2016 Presidential Election by County - Trump.svg
- File:2016 Presidential Election by State - Clinton.svg
- File:2016 Presidential Election by State - Trump.svg
- File:2016 Presidential Election by Vote Distribution Among States.svg
- File:2016 United States presidential election - Percentage of votes cast for Gary Johnson by county.svg
- File:2016 United States presidential election results map by county.svg
- File:2016nationwidecountymapshadedbyvoteshare.svg (檔案重新導向)
- User:Magog the Ogre/Political maps/2016 November 21-30
- User:Magog the Ogre/Political maps/2016 December 11-20
- User:OgreBot/Watercraft/2016 December 14
- User:OgreBot/Watercraft/2016 December 16
- User:OgreBot/Watercraft/2016 December 19
- User:OgreBot/Watercraft/2016 December 20
- User:Magog the Ogre/Political maps/2016 December 21-31
- User:OgreBot/Watercraft/2016 December 24
- User:OgreBot/Watercraft/2016 December 28
- File:Cartogram—2016 Electoral Vote.svg
- File:ElectoralCollege2016.svg
- File:Results by state, shaded according to winning candidate's percentage of the vote 2016.svg
- File:U.S. 2012 to 2016 presidential election swing.svg
- File:U.S. 2012 to 2016 presidential election swing (relative).svg
- File:United States presidential election, 2016 Cartogram.png
- File:United States presidential election results by county, 2016.svg (檔案重新導向)
- File:ElectoralCollege2016.svg
- File:2016 United States presidential election results map by county.svg
- User:Magog the Ogre/Political maps/2016 March 21-31
- File:2016 Presidential Election by County (Red-Blue-Purple View).svg
- File:2016 Presidential Election by County.svg
- File:Cartogram—2016 Electoral Vote.svg
- User:Magog the Ogre/Political maps/2016 November 1-10
- File:Results by state, shaded according to winning candidate's percentage of the vote 2016.svg
- File:2016 Presidential Election by State - Clinton.svg
- File:2016 Presidential Election by Vote Distribution Among States.svg
- File:2016 Presidential Election by County - Clinton.svg
- File:2016 Presidential Election by State - Trump.svg
- File:2016 Presidential Election by County - Trump.svg
- File:U.S. 2012 to 2016 presidential election swing.svg
- File:U.S. 2012 to 2016 presidential election swing (relative).svg
- File:United States presidential election, 2016 Cartogram.png
- Template:United States presidential election maps, 2016
- User:OgreBot/Watercraft/2016 December 11/Overflow 2
- User:Magog the Ogre/Political maps/2016 December 11-20
- User:OgreBot/Watercraft/2016 December 12
- User:OgreBot/Watercraft/2016 December 14
- User:OgreBot/Watercraft/2016 December 17
- User:OgreBot/Watercraft/2016 December 19
- User:OgreBot/Watercraft/2016 December 20
- User:Magog the Ogre/Political maps/2016 December 21-31
- User:OgreBot/Watercraft/2016 December 24
- User:OgreBot/Watercraft/2016 December 25
- User:OgreBot/Watercraft/2016 December 28
- User:Magog the Ogre/Political maps/2017 January 1-10
- User:OgreBot/Watercraft/2017 January 4
- User:Magog the Ogre/Political maps/2017 February 1-9
- User:Magog the Ogre/Political maps/2017 February 10-18
- File:2016 Presidential Election by County (Red-Blue-Purple View).png
- File:2016 United States presidential election - Percentage of votes cast for Gary Johnson by county.svg
- User:Oganesson007/Contributions
- User:Magog the Ogre/Political maps/2017 July 21-31
- User talk:Vartemp
- User talk:Kingofthedead/Archive 3
- User:Magog the Ogre/Political maps/2018 October 21-31
- User:Magog the Ogre/Political maps/2019 October 11-20
- User:Magog the Ogre/Political maps/2019 November 21-30
- User:Magog the Ogre/Political maps/2019 December 1-10
- Template:United States presidential election maps, 2016
.png)
.svg)
全域檔案使用狀況
以下其他 wiki 使用了這個檔案:
- ar.wikipedia.org 的使用狀況
- bg.wikipedia.org 的使用狀況
- ca.wikipedia.org 的使用狀況
- cs.wikipedia.org 的使用狀況
- de.wikipedia.org 的使用狀況
- en.wikipedia.org 的使用狀況
- fa.wikipedia.org 的使用狀況
- fr.wikipedia.org 的使用狀況
- hu.wikipedia.org 的使用狀況
- nl.wikipedia.org 的使用狀況
- no.wikipedia.org 的使用狀況
- pa.wikipedia.org 的使用狀況
- zh.wikipedia.org 的使用狀況