User talk:Vartemp
|
Our first steps tour and our frequently asked questions will help you a lot after registration. They explain how to customize the interface (for example the language), how to upload files and our basic licensing policy (Wikimedia Commons only accepts free content). You don't need technical skills in order to contribute here. Be bold when contributing and assume good faith when interacting with others. This is a wiki. More information is available at the community portal. You may ask questions at the help desk, village pump or on IRC channel #wikimedia-commons (webchat). You can also contact an administrator on their talk page. If you have a specific copyright question, ask at the copyright village pump. |
|
-- Wikimedia Commons Welcome (talk) 00:23, 7 February 2018 (UTC)

|
File:Alabama presidential election results 1972.svg has been listed at Commons:Deletion requests so that the community can discuss whether it should be kept or not. We would appreciate it if you could go to voice your opinion about this at its entry.
If you created this file, please note that the fact that it has been proposed for deletion does not necessarily mean that we do not value your kind contribution. It simply means that one person believes that there is some specific problem with it, such as a copyright issue. Please see Commons:But it's my own work! for a guide on how to address these issues. |
Jcb (talk) 17:09, 9 February 2018 (UTC)
A barnstar for you!
[edit]
|
The Tireless Contributor Barnstar |
Thank you for creating so many election maps!
MB298 (talk) 00:08, 9 March 2018 (UTC) |
Thanks! Vartemp (talk) 01:17, 9 March 2018 (UTC)
Copyright status: File:California Gubernatorial Election Results by County, 2010.svg
[edit]Copyright status: File:California Gubernatorial Election Results by County, 2010.svg
| This media may be deleted. |
Thanks for uploading File:California Gubernatorial Election Results by County, 2010.svg. I notice that the file page either doesn't contain enough information about the license or it contains contradictory information about the license, so the copyright status is unclear.
If you created this file yourself, then you must provide a valid copyright tag. For example, you can tag it with {{self|GFDL|cc-by-sa-all}} to release it under the multi-license GFDL plus Creative Commons Attribution-ShareAlike All-version license or you can tag it with {{PD-self}} to release it into the public domain. (See Commons:Copyright tags for the full list of license tags that you can use.) If you did not create the file yourself or if it is a derivative of another work that is possibly subject to copyright protection, then you must specify where you found it (e.g. usually a link to the web page where you got it), you must provide proof that it has a license that is acceptable for Commons (e.g. usually a link to the terms of use for content from that page), and you must add an appropriate license tag. If you did not create the file yourself and the specific source and license information is not available on the web, you must obtain permission through the VRT system and follow the procedure described there. Note that any unsourced or improperly licensed files will be deleted one week after they have been marked as lacking proper information, as described in criteria for deletion. If you have uploaded other files, please confirm that you have provided the proper information for those files, too. If you have any questions about licenses please ask at Commons:Village pump/Copyright or see our help pages. Thank you. |
Magog the Ogre (talk) (contribs) 04:54, 15 March 2018 (UTC)
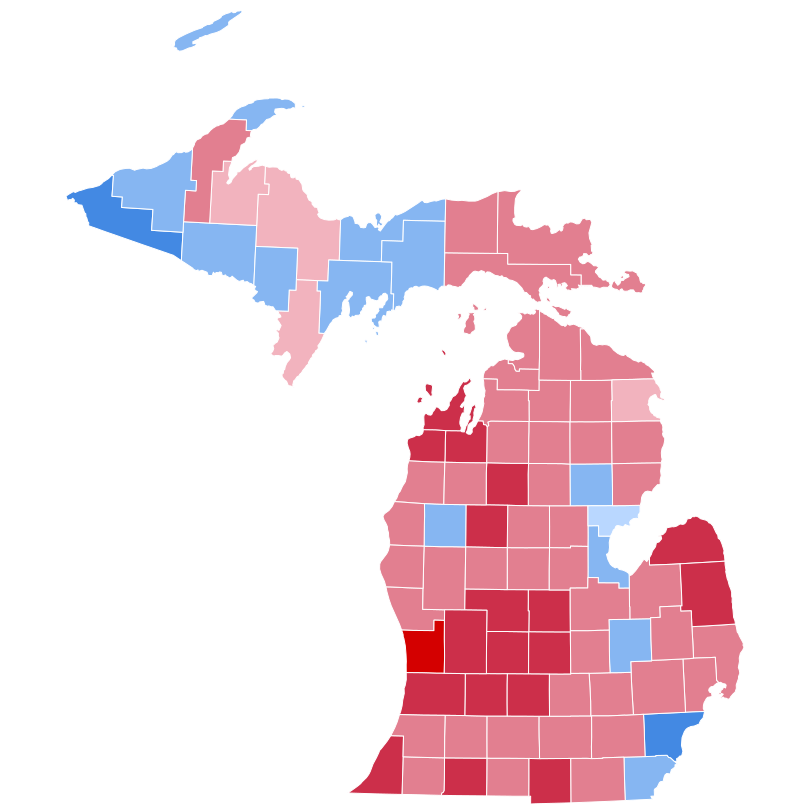
File:United States presidential election in Michigan, 1976 results by county.svg
[edit]Would you be able to adjust the boundaries for the 1976 map of Michigan with the more established line thickness such as for 2012. If so, it would be much appreciated. Thanks! Count Awesome (talk) 04:40, 31 July 2018 (UTC)
- Done! Vartemp (talk) 13:59, 1 August 2018 (UTC)
2018 House election map
[edit]Can you update the House election map to show an incumbent Republican running in Ohio's 12th Congressional District, as Republican Troy Balderson has been declared the winner of the special election there and is on the November ballot? Can you also correct the shading of Pennsylvania's 17th Congressional District, which has incumbent Republican running, but the seat is actually represented by a Democrat, Matthew Cartwright, who is seeking reelection November? If you could make these changes, it would be much appreciated. Thanks! Count Awesome (talk) 19:23, 25 August 2018 (UTC)
- Done! Vartemp (talk) 22:09, 31 August 2018 (UTC)
Thank you! Count Awesome (talk) 04:27, 3 September 2018 (UTC)
File:Tennessee Presidential Election Results 1968.svg
[edit]Would you able to adjust the alignment of the map of Tennessee from 1968 to that of the 2012 map? Also, would you be able to remove the piece of Kentucky which is attached to West Tennessee? It would be very much appreciated. Thanks! Count Awesome (talk) 01:43, 4 September 2018 (UTC)
- That should do it. Vartemp (talk) 12:08, 4 September 2018 (UTC)
File:United States presidential election in Arizona, 1976 results by county.svg
[edit]Thank you for making the corrections on the Tennessee map. Could you change the shading of Pima County in 1976 from a Republican win of 50-60% to a win of 40-50%? President Ford only took 49.8% of the vote, just shy of 50%. If you could make this fix, it would be much appreciated. Count Awesome (talk) 14:45, 7 September 2018 (UTC)
File:Texas Presidential Election Results 2016.svg
[edit]Would you be able to correct the shading of Caldwell County, located to the southeast of Austin, in the 2016 map? It is shaded for a Republican win of 60-70%, but it was carried by Donald Trump with only 54.9% of the vote. Also, I have noticed that the alignment of the 2016 Texas map is slightly different from previous maps, with earlier maps, such as the 2012 map being tilted. If you could make this fix, it would be much appreciated! Thanks! Count Awesome (talk) 01:51, 10 September 2018 (UTC)
- That should fix it. Sorry for the late response. Vartemp (talk) 14:44, 21 September 2018 (UTC)
File:Pennsylvania presidential election results 2012.svg
[edit]Could you change the shading of Bucks County, Pennsylvania and Ohio County, West Virginia for the 2012 presidential election? Bucks County is shaded for a Democratic win of 50-60%, but Obama came up a bit short of 50% in the county, winning 49.97% of the vote. Ohio County is shaded for a Republican win 60-70%, but Romney carried the county with 59.96% of the vote. If you could make these changes, it would be much appreciated. Thanks! Count Awesome (talk) 23:59, 2 October 2018 (UTC)
- Both done! Vartemp (talk) 19:33, 14 October 2018 (UTC)
File:Domestic trips made by Donald Trump in 2018.svg
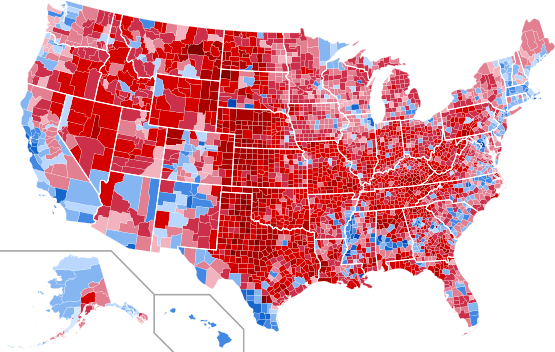
[edit]Thanks for making the changes on the 2012 presidential maps! Can you update the Domestic trips made by Donald Trump in 2018 map please? I have noticed the editors who were doing it in the past appear to be inactive and the map has not been edited in a couple of months. Could you add one visit to Kansas, Kentucky, Mississippi, and South Dakota; two visits to Iowa, Indiana, Minnesota, Montana, Nevada, North Dakota, and South Carolina; three visits to Missouri, North Carolina, and Tennessee; four visits to New York; five visits to West Virginia; and six visits to Ohio and Pennsylvania. I know this is quite a bit, and I would be very appreciative if you could make this update. Thanks! Count Awesome (talk) 22:51, 14 October 2018 (UTC)
- Done. I think I got that right. Vartemp (talk) 21:49, 15 October 2018 (UTC)
File:Missouri Presidential Election Results 2016.svg
[edit]
 Thanks for updating the presidential trip map! Could you correct an error with the shading of McDonald County, Missouri, which is located in the southwestern corner of that state bordering both Arkansas and Oklahoma? The state level and national county maps both have it shaded for a Republican win of 80-90%. However, the county was actually carried by Donald Trump with 79.5% of the vote. If you could make these corrections, it would be much appreciated. Thanks! Count Awesome (talk) 18:17, 27 October 2018 (UTC)
File:North Dakota Presidential Election Results 2016.svg
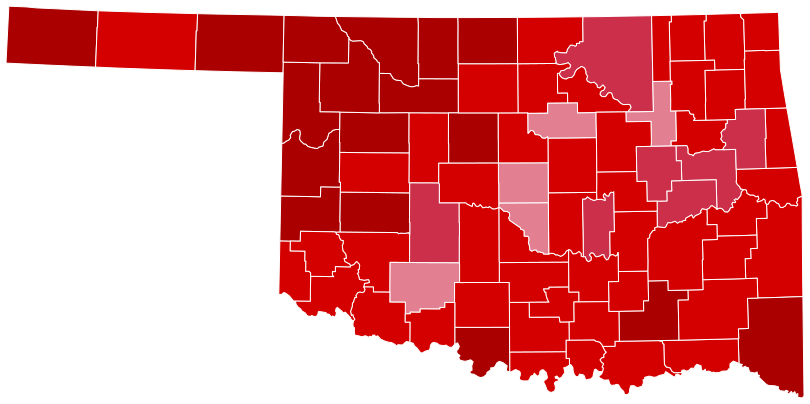
[edit]Thank you for making the corrections on the map of Missouri! Could you correct the shading of Cass County, North Dakota, which is shaded for a Republican win of 50-60% but was actually won by Trump with 49.3% of the vote? Also, could you also make a couple of corrections on the 2016 map for Oklahoma? Payne County, located to the northeast of Oklahoma City, is shaded for a Republican win of 60-70% but was actually carried by Donald Trump with 59.98% of the vote. Also, Texas County, located in the panhandle of the state, was shaded for a Republican win of 80-90% but was Trump actually won with 79.95% of the vote. If you could make these fixes, it would be much appreciated. Thank you! Count Awesome (talk) 20:30, 3 November 2018 (UTC)
2018 Georgia gubernatorial map
[edit]File:Georgia Governor Election Results 2018.svg

Hi Vartemp! I really appreciate the corrections you made on the maps of North Dakota and Oklahoma. I noticed that a map was made for the governor's race held recently in Georgia, but it was made in the same format as a presidential map. Could you change the map to be in the style of previous gubernatorial maps? If so, it would be much appreciated. Thank you! Count Awesome (talk) 17:10, 19 November 2018 (UTC)
- Done. Replaced with File:Georgia Governor Election Results by County, 2018.svg. Vartemp (talk) 23:46, 19 November 2018 (UTC)
Thank you Vartemp! That map fits much better. I noticed that there is a county in the southwest of the state which is gray in color. That county, Schley County, went for the Republican Brian Kemp with 80.96% of the vote according Dave Liep's Atlas of U.S. Presidential Elections. Also, could you change the shading of Gilmer County in the north of that state. It is shaded for a Republican win of 70-80%, but Kemp actually won it with 83.70% of the vote. I really appreciate you creating this new map, as well as your prompt response. Thanks! Count Awesome (talk) 02:45, 20 November 2018 (UTC)
- Thanks for pointing those out. All done. Vartemp (talk) 12:55, 20 November 2018 (UTC)
2018 Tennessee and Arkansas gubernatorial maps
[edit]Thank you again for making the map for the gubernatorial race in Georgia! Could you make maps for the gubernatorial races held recently in Tennessee and Arkansas? I would appreciate it. Thank you! Count Awesome (talk) 04:19, 21 November 2018 (UTC)
- Done and done. Vartemp (talk) 15:14, 21 November 2018 (UTC)
2018 US House Election Map
[edit]Hi, you recently marked the map I made for the 2018 US House election for deletion and replaced it with your own version. I was just wondering your reasons for replacing it. I can definitely understand if my map had mistakes or was of poor quality or format, but none of those seem to be case. Thanks --Kairom13 (talk) 06:12, 21 November 2018 (UTC)
- I did it because the svg format is usually used for the house election page on Wikipedia. Like for example, there's File:US House 2016.svg, and File:US House 2014.svg, used on their respective pages for the US House elections. Uniformity, if you will. Vartemp (talk) 13:41, 21 November 2018 (UTC)
- Alright. It doesn't matter too much to me, although the deletion was probably unwarranted (most people seem to think that as well). I will say that, just because it's always been done a certain way, it doesn't mean that's the only way, especially since the quality of the image was in no way improved by the change.--Kairom13 (talk) 04:24, 23 November 2018 (UTC)
2018 Texas, New Mexico, and Arizona gubernatorial maps
[edit]Hi Vartemp! Would you be able to make maps for the governor's races held recently in Texas, New Mexico, and Arizona? If you could, it would be much appreciated. Thank you and Happy Thanksgiving! Count Awesome (talk) 01:04, 23 November 2018 (UTC)
- File:New Mexico Governor Election Results by County, 2018.svg, File:Texas Governor Election Results by County, 2018.svg. Vartemp (talk) 02:50, 2 December 2018 (UTC)
2018 South Carolina and Ohio gubernatorial maps
[edit]Hi Vartemp, I would like to thank you for creating the gubernatorial maps for New Mexico and Texas, and I would like to let you know I have added them to their respective pages. I was wondering if you would be willing to make maps for the governor's races held this year in South Carolina and Ohio? These are among the last states not to have a map for the recent gubernatorial contests. If you could, it would be much appreciated. Thank you! Count Awesome (talk) 05:10, 4 December 2018 (UTC)
- Done. Sorry for the delay. Vartemp (talk) 16:11, 15 December 2018 (UTC)


