File:Boiling-point-composition diagram of chloroform acetone.svg
Jump to navigation
Jump to search

Size of this PNG preview of this SVG file: 729 × 600 pixels. Other resolutions: 292 × 240 pixels | 584 × 480 pixels | 934 × 768 pixels | 1,245 × 1,024 pixels | 2,490 × 2,048 pixels | 749 × 616 pixels.
Original file (SVG file, nominally 749 × 616 pixels, file size: 124 KB)
Captions
Captions
Add a one-line explanation of what this file represents
Summary[edit]
| Description |
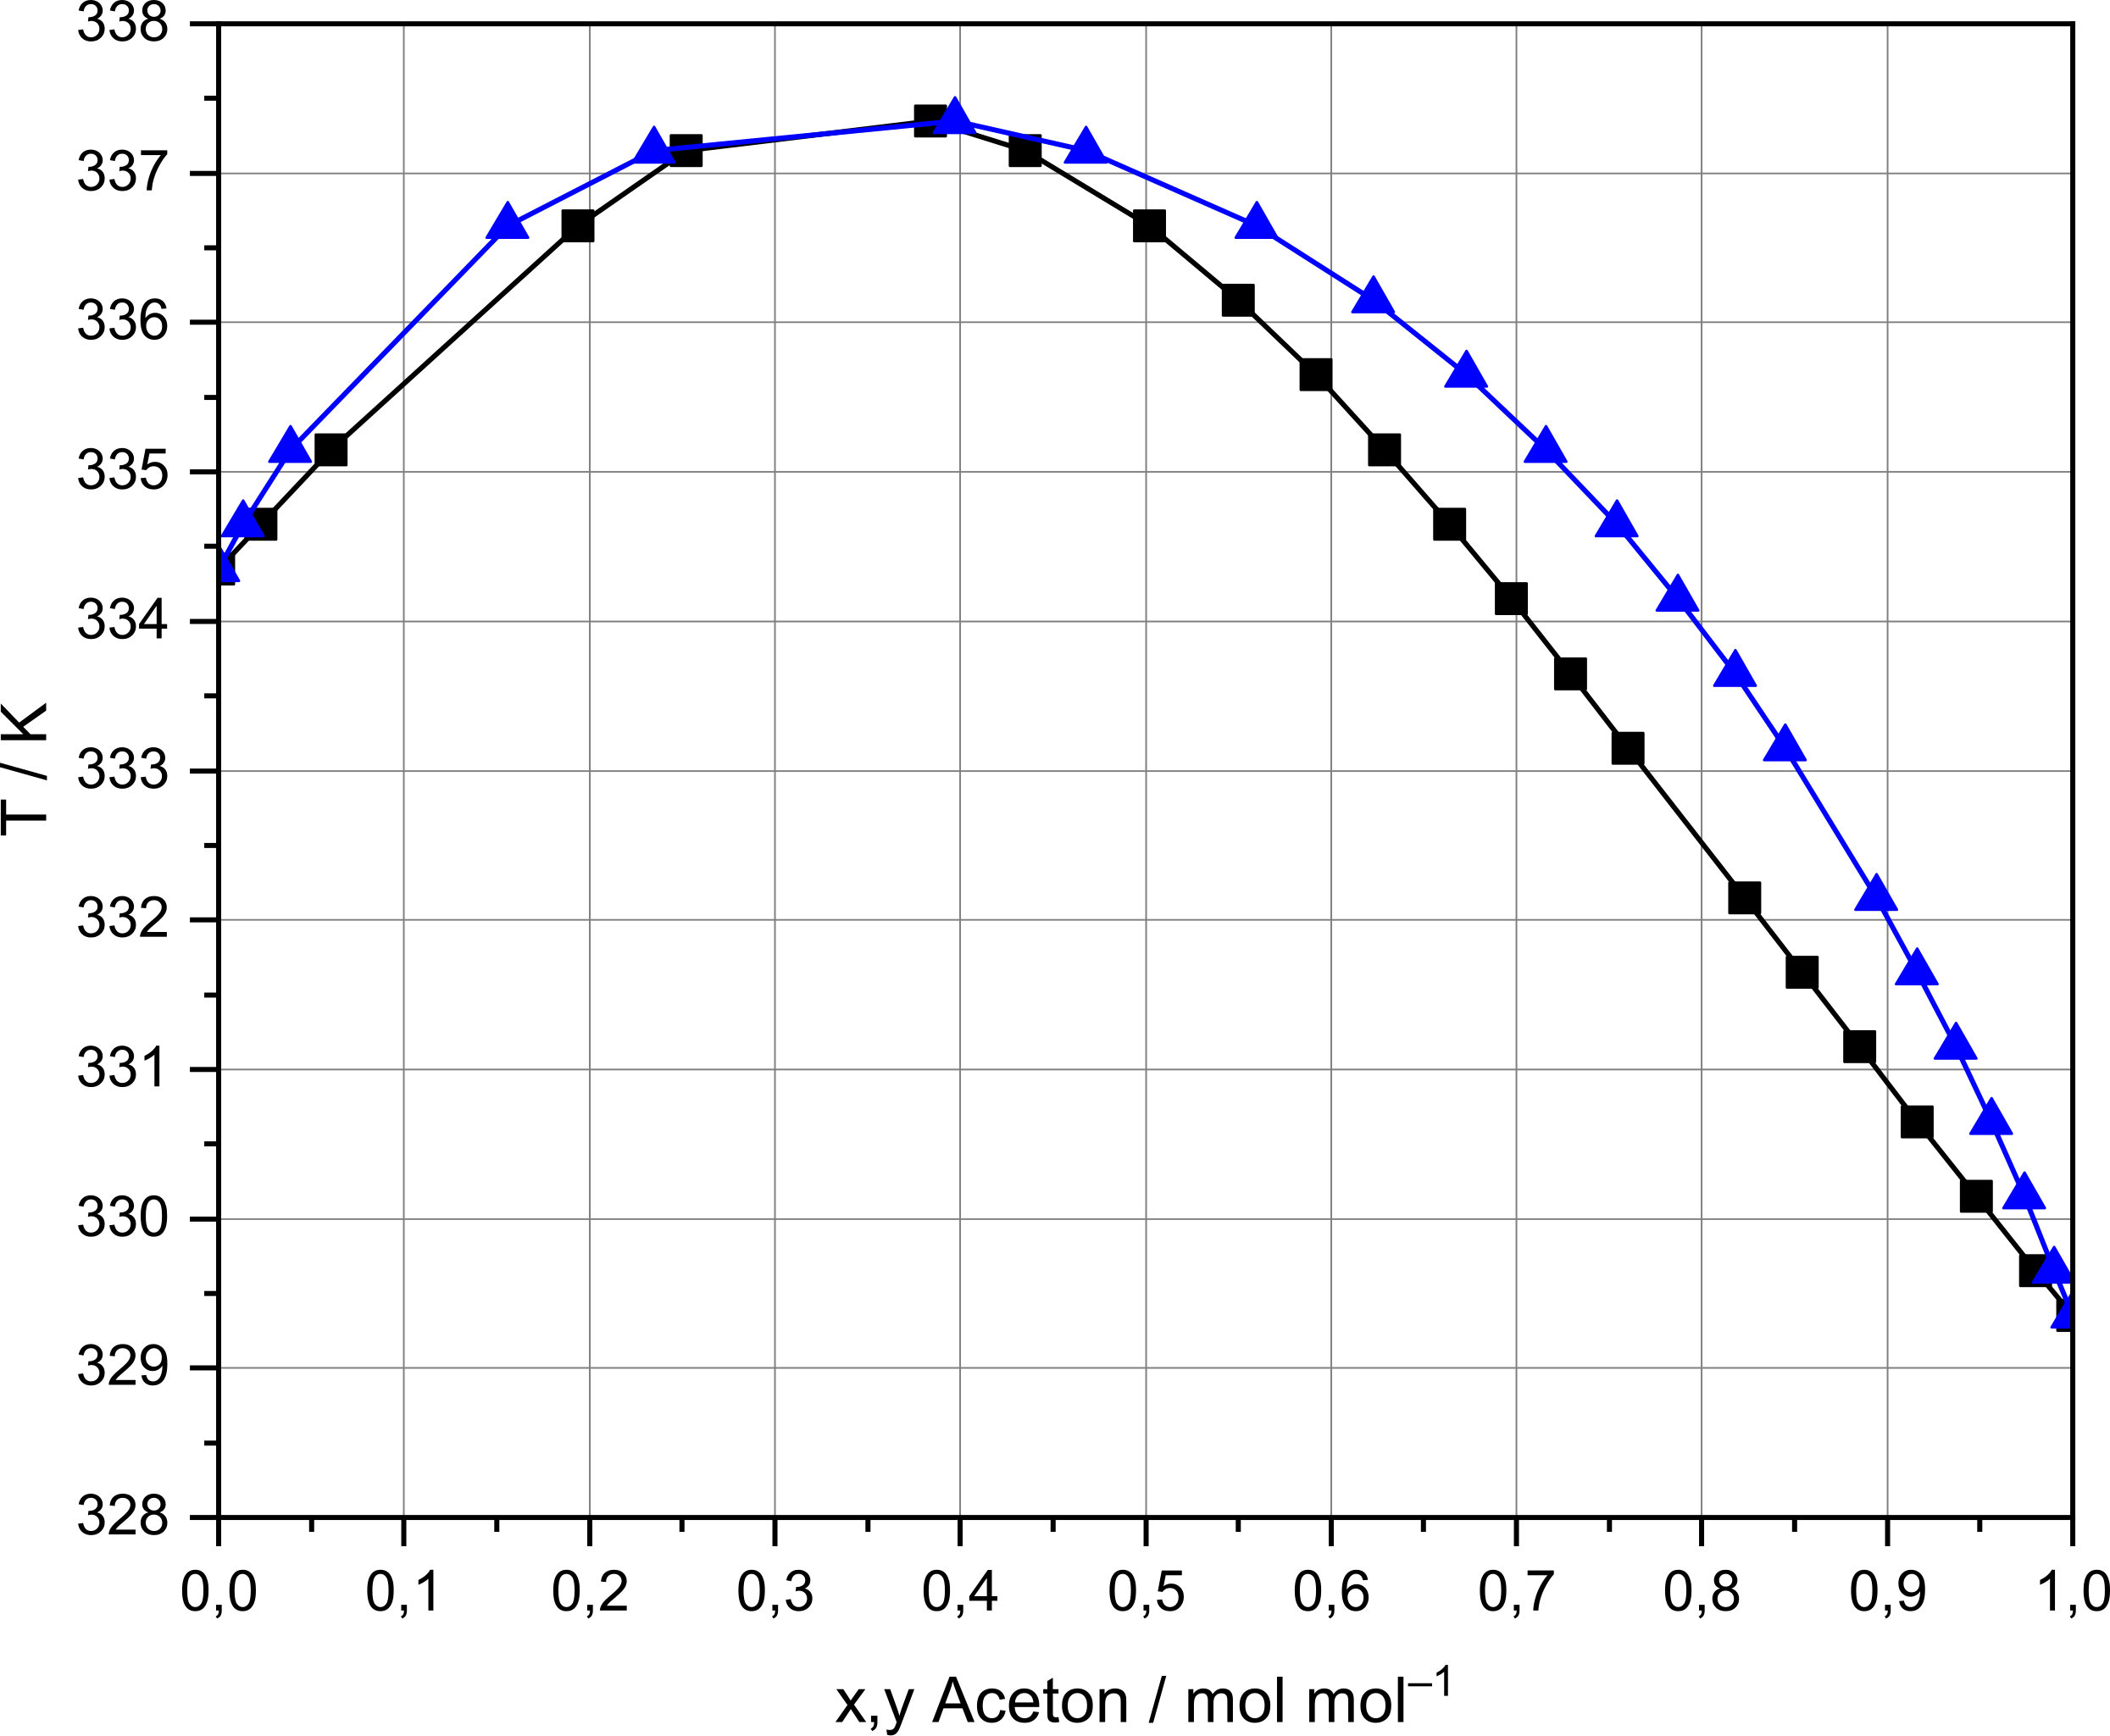
Boiling-point-composition diagram (T-x,y-diagram) of a mixture of chloroform and acetone at p = 101.325 kPa. Source of the Vapor–liquid equilibrium data: A. Apelblat, A. Tamir, M. Wagner, Fluid Phase Equilib. 1980, 4, 229–255 Image created in OriginPro 2022 and converted into a vector graphic using Scribus 1.5.4 and Inkscape 1.2.1 |
||
| Date | |||
| Source | Own work | ||
| Author | Chem Sim 2001 | ||
| Permission (Reusing this file) |
|
||
| SVG development | This vector image was created with Inkscape. |
File history
Click on a date/time to view the file as it appeared at that time.
| Date/Time | Thumbnail | Dimensions | User | Comment | |
|---|---|---|---|---|---|
| current | 08:15, 9 December 2022 | | 749 × 616 (124 KB) | Chem Sim 2001 (talk | contribs) | == {{int:filedesc}} == {{Information | Description = Boiling-point-composition diagram (''T''-''x,y''-diagram) of a mixture of {{W|chloroform}} and {{W|acetone}} at ''p'' = 101.325 kPa. Source of the {{W|Vapor–liquid equilibrium}} data: [https://doi.org/10.1016/0378-3812(80)80018-5 A. Apelblat, A. Tamir, M. Wagner, ''Fluid Phase Equilib.'' '''1980''', ''4'', 229–255] Image created in OriginPro 2022 and converted into a vector graphic... |
You cannot overwrite this file.
File usage on Commons
There are no pages that use this file.
File usage on other wikis
The following other wikis use this file:
- Usage on de.wikipedia.org