File:Einwohnerentwicklung von Geislingen an der Steige.svg
Jump to navigation
Jump to search

Size of this PNG preview of this SVG file: 800 × 400 pixels. Other resolutions: 320 × 160 pixels | 640 × 320 pixels | 1,024 × 512 pixels | 1,280 × 640 pixels | 2,560 × 1,280 pixels.
Original file (SVG file, nominally 800 × 400 pixels, file size: 31 KB)
Captions
Captions
Add a one-line explanation of what this file represents
Summary
[edit]
| Description |
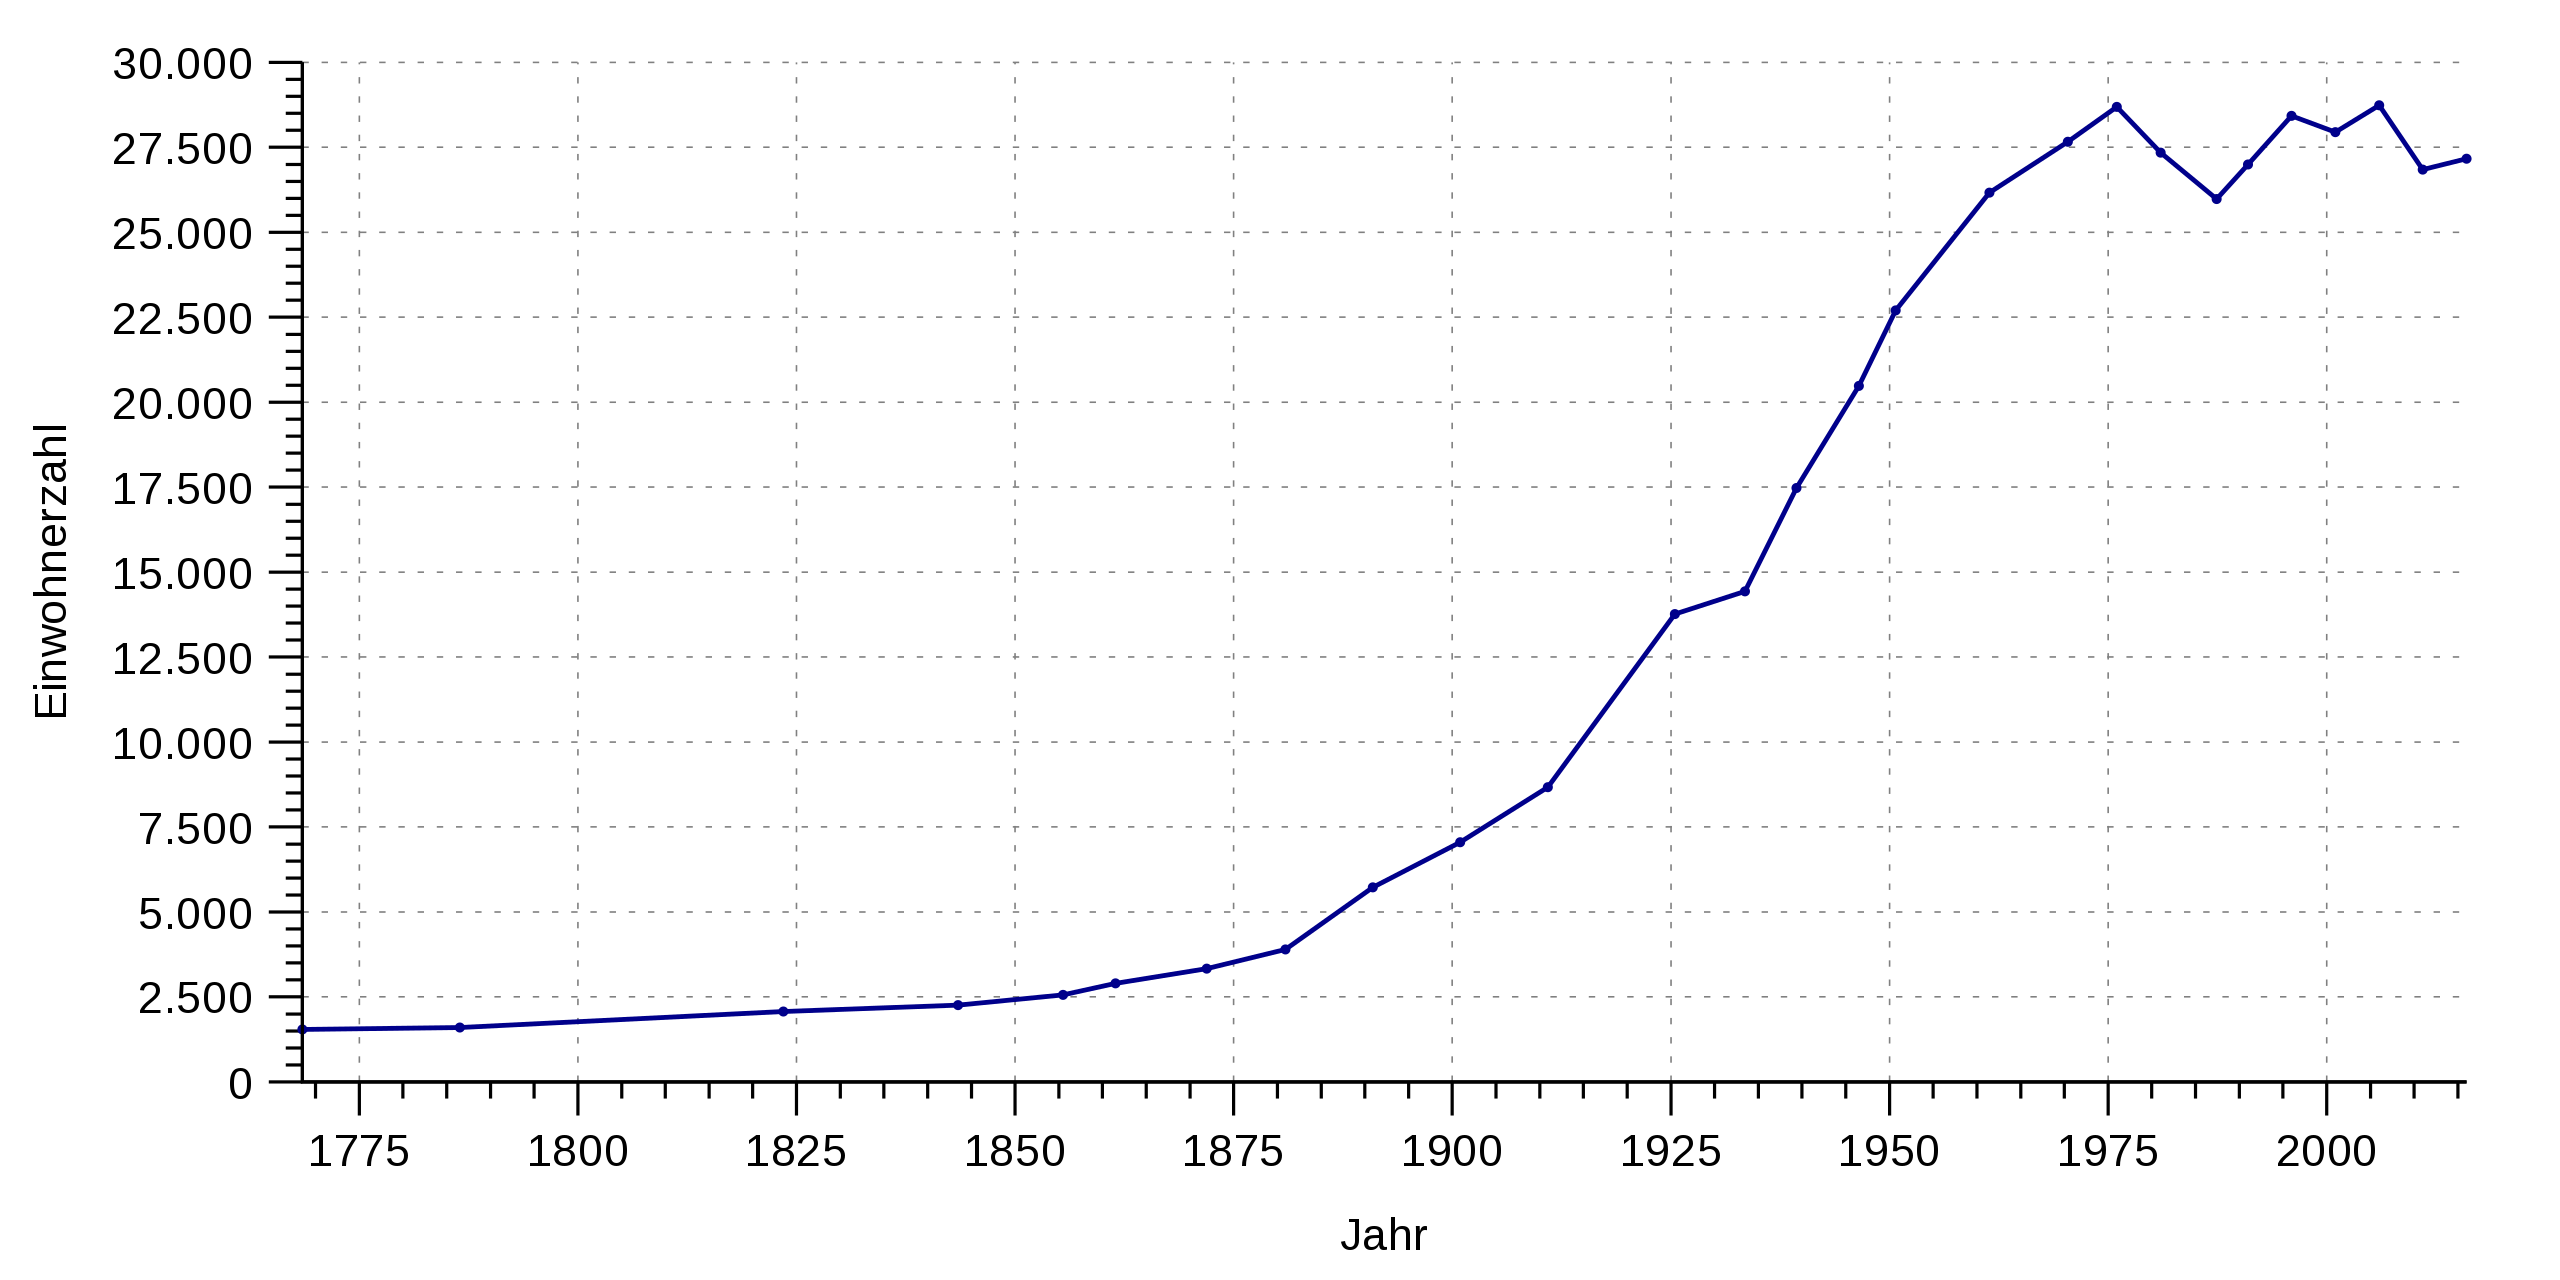
Deutsch: Einwohnerentwicklung von Geislingen_an_der_Steige |
| Source | Own work |
| Author | Summer ... hier! (talk) 21:21, 8 December 2017 (UTC) |
Licensing
[edit]
I, the copyright holder of this work, hereby publish it under the following license:
| This file is made available under the Creative Commons CC0 1.0 Universal Public Domain Dedication. | |
| The person who associated a work with this deed has dedicated the work to the public domain by waiving all of their rights to the work worldwide under copyright law, including all related and neighboring rights, to the extent allowed by law. You can copy, modify, distribute and perform the work, even for commercial purposes, all without asking permission.
|
Gnuplot script to generate this plot
[edit]
This plot was created with Gnuplot.
#!/usr/bin/gnuplot
# gnuplot


# Allgemeines zu den Eingabedaten
set timefmt "%d.%m.%Y"     # Zeitangaben in TT.MM.YYYY
set datafile separator ";" # Spaltenseparator


# Allgemeines zur Ausgabe
unset key
set style data lines
set style fill transparent solid 0.4
set grid
set border 3               # Bit 1 (unten) + Bit 2 (links)


# Bereiche/Format/etc X-Achse
set xdata time
set xlabel 'Jahr'          # Beschr. X-Achse
set xlabel offset 0, 0.75  # Schrift etwas höher
set xrange ['30.06.1768':'31.12.2015']
set xtics '01.01.1000', 60 * 60 * 24 * 365.25 * 25
                           # xtics in Sekunden
                           # der Beginn der X-Einteilung kann außerhalb xrange
                           # liegen
set xtics offset  0, 0.5   # Beschritung näher an die X-Achse
set mxtics 5               # Skalenstriche
set xtics nomirror         # Nur unten Skalieren
set format x '%Y'          # Beschriftungsformat JJJJ
set xtics  out             # Skal. aussen damit sich nicht von Grafik
                           # überschr. wird


# Bereiche/Format/etc Y-Achse
set ylabel 'Einwohnerzahl' offset 2 # Abstand Achse/Label
set yrange [0:]
set ytics 2500
set ytics offset 0.5       # Schrift etwas nach rechts
set ytics nomirror
set decimalsign locale "de_DE.utf8" # Stelle Input und Output auf "," um
                           # set decimalsign ',' würde nur Output umstellen,
set format y  "%'.0f"      # Ausgabeformat
set mytics 5
set ytics  out             # Skal. aussen da sie sonst von Grafik
                           # überschr. wird


# Ausgabeformat: Wir erzeugen SVG
# Die Ausgabedaten leiten wir in eine Pipe und sind so bei Namen der
# Ausgabedatei flexibel (Aufruf: Progname.plt > Ausgabe-svg)
set term svg size 800,400 font "Arial,14"
# keine "set output '<Dateiname>'" Angabe


# Erzeugen der Ausgabe
plot \
  'Einwohnerentwicklung_von_Geislingen_an_der_Steige.dat' using 1:2 with linespoints linecolor 'dark-blue'   linetype 1 linewidth 1.5 pointtype 7 pointsize 0.30,\
Daten
[edit]
Die folgenden Daten bitte in eine Textdatei unter dem Namen .dat abspeichern und ins gleiche Verzeichnis wie das GnuPlot-Script ablegen.
#
#
#
#
30.06.1768; 1541
30.06.1786; 1600
30.06.1823; 2075
30.06.1843; 2257
30.06.1855; 2560
30.06.1861; 2902
01.12.1871; 3334
01.12.1880; 3902
01.12.1890; 5722
01.12.1900; 7050
01.12.1910; 8674
16.06.1925;13762
16.06.1933;14439
17.05.1939;17478
#
30.06.1946;20478
13.09.1950;22699
06.06.1961;26169
27.05.1970;27662
31.12.1975;28693
31.12.1980;27344
27.05.1987;25980
31.12.1990;26993
31.12.1995;28429
31.12.2000;27947
31.12.2005;28737
31.12.2010;26841
31.12.2015;27168
EOF
File history
Click on a date/time to view the file as it appeared at that time.
| Date/Time | Thumbnail | Dimensions | User | Comment | |
|---|---|---|---|---|---|
| current | 21:21, 8 December 2017 | | 800 × 400 (31 KB) | Summer ... hier! (talk | contribs) | {{Information |Description = {{de|Einwohnerentwicklung von Geislingen_an_der_Steige}} |Source = {{own}} |Author = ~~~~ |Date = }} == {{int:license-header}} == {{self|Cc-zero}} == Gnuplot script to generate this plot == {... |
You cannot overwrite this file.
File usage on Commons
There are no pages that use this file.
File usage on other wikis
The following other wikis use this file:
- Usage on azb.wikipedia.org
- Usage on de.wikipedia.org
- Usage on ja.wikipedia.org