File:Exponential Function Argument.png
ナビゲーションに移動
検索に移動

このプレビューのサイズ: 728 × 600 ピクセル。 その他の解像度: 292 × 240 ピクセル | 583 × 480 ピクセル | 933 × 768 ピクセル | 1,244 × 1,024 ピクセル | 1,700 × 1,400 ピクセル。
元のファイル (1,700 × 1,400 ピクセル、ファイルサイズ: 593キロバイト、MIME タイプ: image/png)
キャプション
キャプション
このファイルの内容を1行で記述してください
| 解説 |
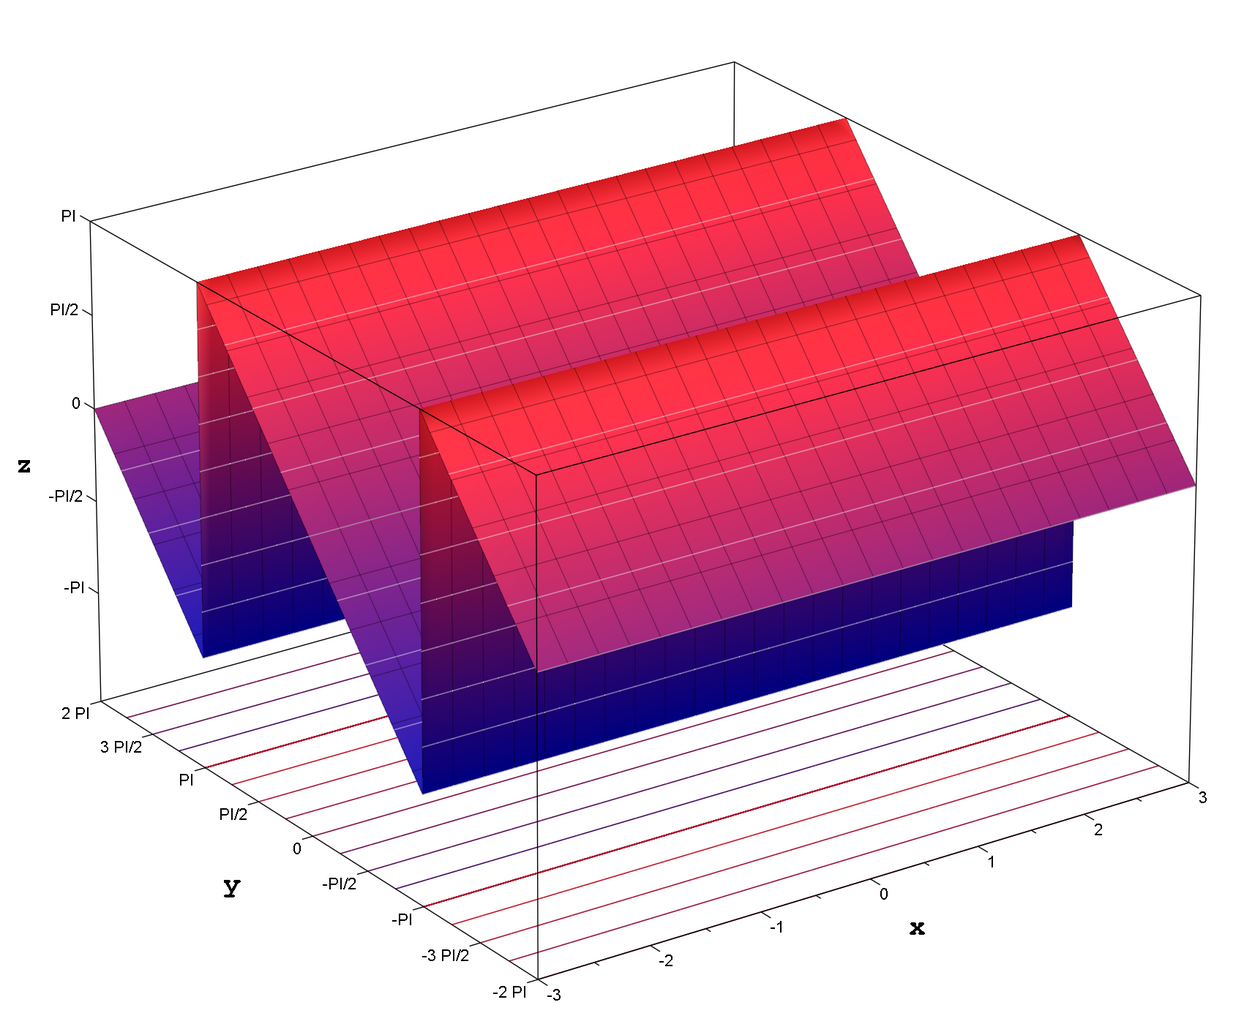
Diagram of the argument of the exponential function in the complex plane. The plot is given by: |
||
| 日付 | |||
| 原典 | Own drawing, Plotted in MuPAD, code given below. | ||
| 作者 | Inductiveload | ||
| 許可 (ファイルの再利用) |
|
||
| その他のバージョン | See Exponential function for related graphics. |

MuPAD Code
[編集]
  q := arg(exp(x+I*y)):

  conts := 10:
  projectionlevel:=-5:
  ylimit := 2*PI:
  xlimit := 3:
  submeshlevel := 0:

colourfunc := zip(RGB::VenetianRed, RGB::DarkBlue,
                  (a, b) -> (q(x,y)+PI)/(6)*a
                           -(q(x,y)-PI)/(6)*b):

funcplot := plot::Function3d(q(x,y),
                             x = -xlimit..xlimit,
                             y = -ylimit..ylimit,
                             Mesh = [23, 23],
                             Submesh = [submeshlevel,submeshlevel],
                             LineColor = RGB::Black.[0.4],
                             LineWidth = 0.15,
                             AdaptiveMesh = 10,
                             FillColorFunction = colourfunc,
                             AxesTitleFont = ["Courier New", Bold, 14],
                             ViewingBoxZRange = -5..PI,
                             YTicksNumber = None,
                             YTicksAt = [-3*PI/2 = "-3 PI/2", -PI = "-PI", -PI/2 = "-PI/2", -2*PI = "-2 PI",
                                         0 = "0",
                                         PI/2 = "PI/2", PI = "PI",  3*PI/2 = "3 PI/2", 2*PI = "2 PI"],
                             ZTicksNumber = None,
                             ZTicksAt = [-PI = "-PI", -PI/2 = "-PI/2",
                                         0 = "0",
                                         PI/2 = "PI/2", PI = "PI"]
                            ):

contours := plot::modify(funcplot,
                         ZContours = [$ -3.14..3.14 step 0.7853],
                         LineWidth = 0.2,
                         LineColor = RGB::Gray90.[0.5],
                         XLinesVisible = FALSE,
                         YLinesVisible = FALSE,
                         Filled = FALSE
                        ):

projcontours := plot::Transform3d([0, 0, projectionlevel],
                                  [1, 0, 0, 0, 1, 0, 0, 0, 0],
                                   plot::modify(funcplot, ZContours = [$ -3.14..3.14 step 0.7853],
                                                LineWidth = 0.2,
                                                LineColorType = Dichromatic,
                                                LineColor = RGB::VenetianRed.[0.99],
                                                LineColor2 = RGB::DarkBlue.[0.99],
                                                XLinesVisible = FALSE,
                                                YLinesVisible = FALSE,
                                                Filled = FALSE
                                               )
                                  ):

camera := plot::Camera([-40, -120, 60],
                       [-0.5, -1, -0.5],
                       0.1
                      ):

ploteverything := plot::Canvas(funcplot, contours, projcontours,
                               Width = 8.5*unit::inch,
                               Height = 7*unit::inch,
                               camera
                              ):

plot(ploteverything)
ファイルの履歴
過去の版のファイルを表示するには、その版の日時をクリックしてください。
| 日付と時刻 | サムネイル | 寸法 | 利用者 | コメント | |
|---|---|---|---|---|---|
| 現在の版 | 2007年4月25日 (水) 19:54 | | 1,700 × 1,400 (593キロバイト) | Inductiveload (トーク | 投稿記録) | {{Information |Description=Diagram of the argument of the exponential function in the complex plane. The plot is given by: ::<math>z=\operatorname{arg} \left (\exp \left( \frac{1}{x + i y} \right)\right)</math> |Source=Own drawing, Plotted in MuPAD, code |
このファイルは上書きできません。
ファイルの使用状況
以下のページがこのファイルを使用しています:
グローバルなファイル使用状況
以下に挙げる他のウィキがこの画像を使っています:
- en.wikibooks.org での使用状況
- fr.wikipedia.org での使用状況
- ja.wikipedia.org での使用状況