File:IrisDAbiplot.jpg
Jump to navigation
Jump to search
Size of this preview: 800 × 275 pixels. Other resolutions: 320 × 110 pixels | 1,151 × 395 pixels.
Original file (1,151 × 395 pixels, file size: 47 KB, MIME type: image/jpeg)
Captions
Captions
Add a one-line explanation of what this file represents

|
This diagram image could be re-created using vector graphics as an SVG file. This has several advantages; see Commons:Media for cleanup for more information. If an SVG form of this image is available, please upload it and afterwards replace this template with
{{vector version available|new image name}}.
It is recommended to name the SVG file “IrisDAbiplot.svg”—then the template Vector version available (or Vva) does not need the new image name parameter. |


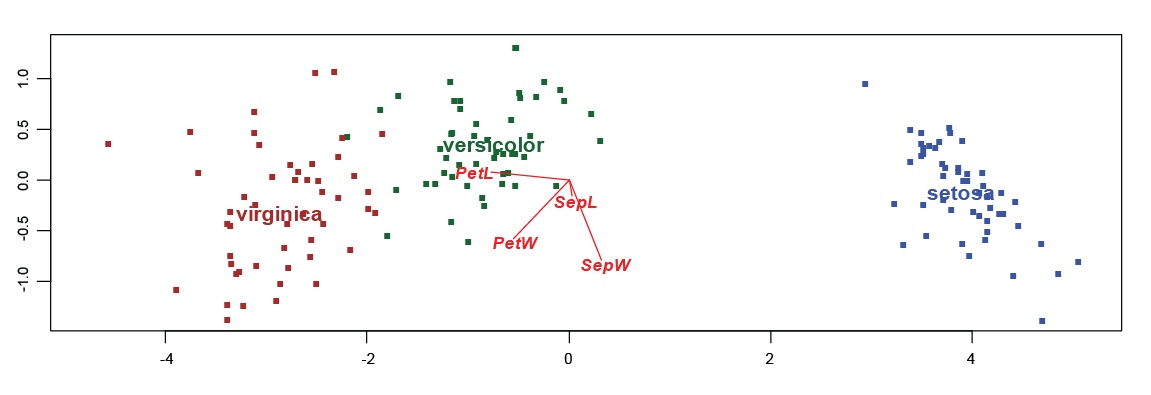
| Description | Discriminant Analysis Biplot of Fisher's Iris Data: this version of the biplot is called a Contribution Biplot because it shows which of the variables are contributing most to the separation of the Iris classes - since the three classes are separated horizontally it is clearly the variable Petal Length (PetL) that is the principal separator of the three classes. PetL has the largest coordinate on the horizontal axis, showing Virginica to have the highest values of PetL, then Versicolor, and then Setosa with much lower values - this can be verified by looking at the original Iris data set. | ||
| Date | |||
| Source | Own work | ||
| Author | Michael.greenacre | ||
| Permission (Reusing this file) |
|

File history
Click on a date/time to view the file as it appeared at that time.
| Date/Time | Thumbnail | Dimensions | User | Comment | |
|---|---|---|---|---|---|
| current | 15:26, 16 February 2017 | 1,151 × 395 (47 KB) | Quibik (talk | contribs) | Cropped 2 % horizontally and 36 % vertically using CropTool with lossless mode. | |
| 18:34, 3 August 2010 |  | 1,174 × 615 (52 KB) | Michael.greenacre (talk | contribs) | {{Information |Description=Discriminant Analysis Biplot of Fisher's Iris Data |Source={{own}} |Date=3 August 2010 |Author= Michael.greenacre |Permission= |other_versions= }} |
You cannot overwrite this file.
File usage on Commons
There are no pages that use this file.
File usage on other wikis
The following other wikis use this file:
- Usage on en.wikipedia.org
- Usage on fa.wikipedia.org
- Usage on pt.wikipedia.org