File:Land vs Ocean Temperature cs.svg
Jump to navigation
Jump to search

Size of this PNG preview of this SVG file: 800 × 571 pixels. Other resolutions: 320 × 228 pixels | 640 × 457 pixels | 1,024 × 731 pixels | 1,280 × 913 pixels | 2,560 × 1,827 pixels | 960 × 685 pixels.
Original file (SVG file, nominally 960 × 685 pixels, file size: 34 KB)
Captions
Captions
Add a one-line explanation of what this file represents
Summary[edit]
| Description |
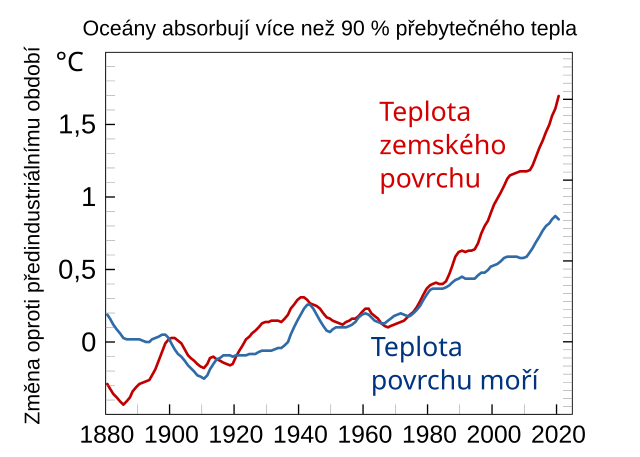
English: Chart with data from NASA showing how land and sea surface air temperatures have changed vs the IPCC pre-industrial baseline of 1850 to 1900. The ocean is absorbing over 90% of excess heat trapped in the atmosphere, greatly limiting global temperature change but contributing to sea level rise, coral bleaching, and other adverse effects.
Link to NASA GISS data access page and direct link to chart data, before being adjusted to be against IPCC baseline temp instead of mid century average. |
| Date | |
| Source | Own work |
| Author | Efbrazil |
| Other versions |
|


Licensing[edit]
I, the copyright holder of this work, hereby publish it under the following license:
This file is licensed under the Creative Commons Attribution-Share Alike 4.0 International license.
- You are free:
- to share – to copy, distribute and transmit the work
- to remix – to adapt the work
- Under the following conditions:
- attribution – You must give appropriate credit, provide a link to the license, and indicate if changes were made. You may do so in any reasonable manner, but not in any way that suggests the licensor endorses you or your use.
- share alike – If you remix, transform, or build upon the material, you must distribute your contributions under the same or compatible license as the original.
File history
Click on a date/time to view the file as it appeared at that time.
| Date/Time | Thumbnail | Dimensions | User | Comment | |
|---|---|---|---|---|---|
| current | 13:22, 30 December 2022 | | 960 × 685 (34 KB) | Jirka Dl (talk | contribs) | Uploaded own work with UploadWizard |
You cannot overwrite this file.
File usage on Commons
The following 2 pages use this file:
File usage on other wikis
The following other wikis use this file:
- Usage on cs.wikipedia.org