File:Logarithm derivative.svg
跳至導覽
跳至搜尋

此 SVG 檔案的 PNG 預覽的大小:375 × 243 像素。 其他解析度:320 × 207 像素 | 640 × 415 像素 | 1,024 × 664 像素 | 1,280 × 829 像素 | 2,560 × 1,659 像素。
原始檔案 (SVG 檔案,表面大小:375 × 243 像素,檔案大小:44 KB)
說明
說明
添加單行說明來描述出檔案所代表的內容
摘要[編輯]
| 描述 |
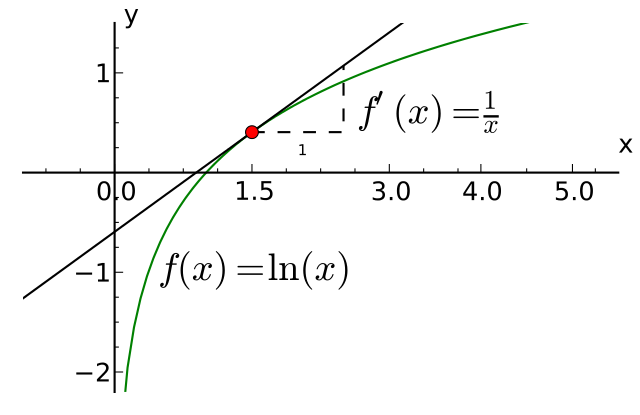
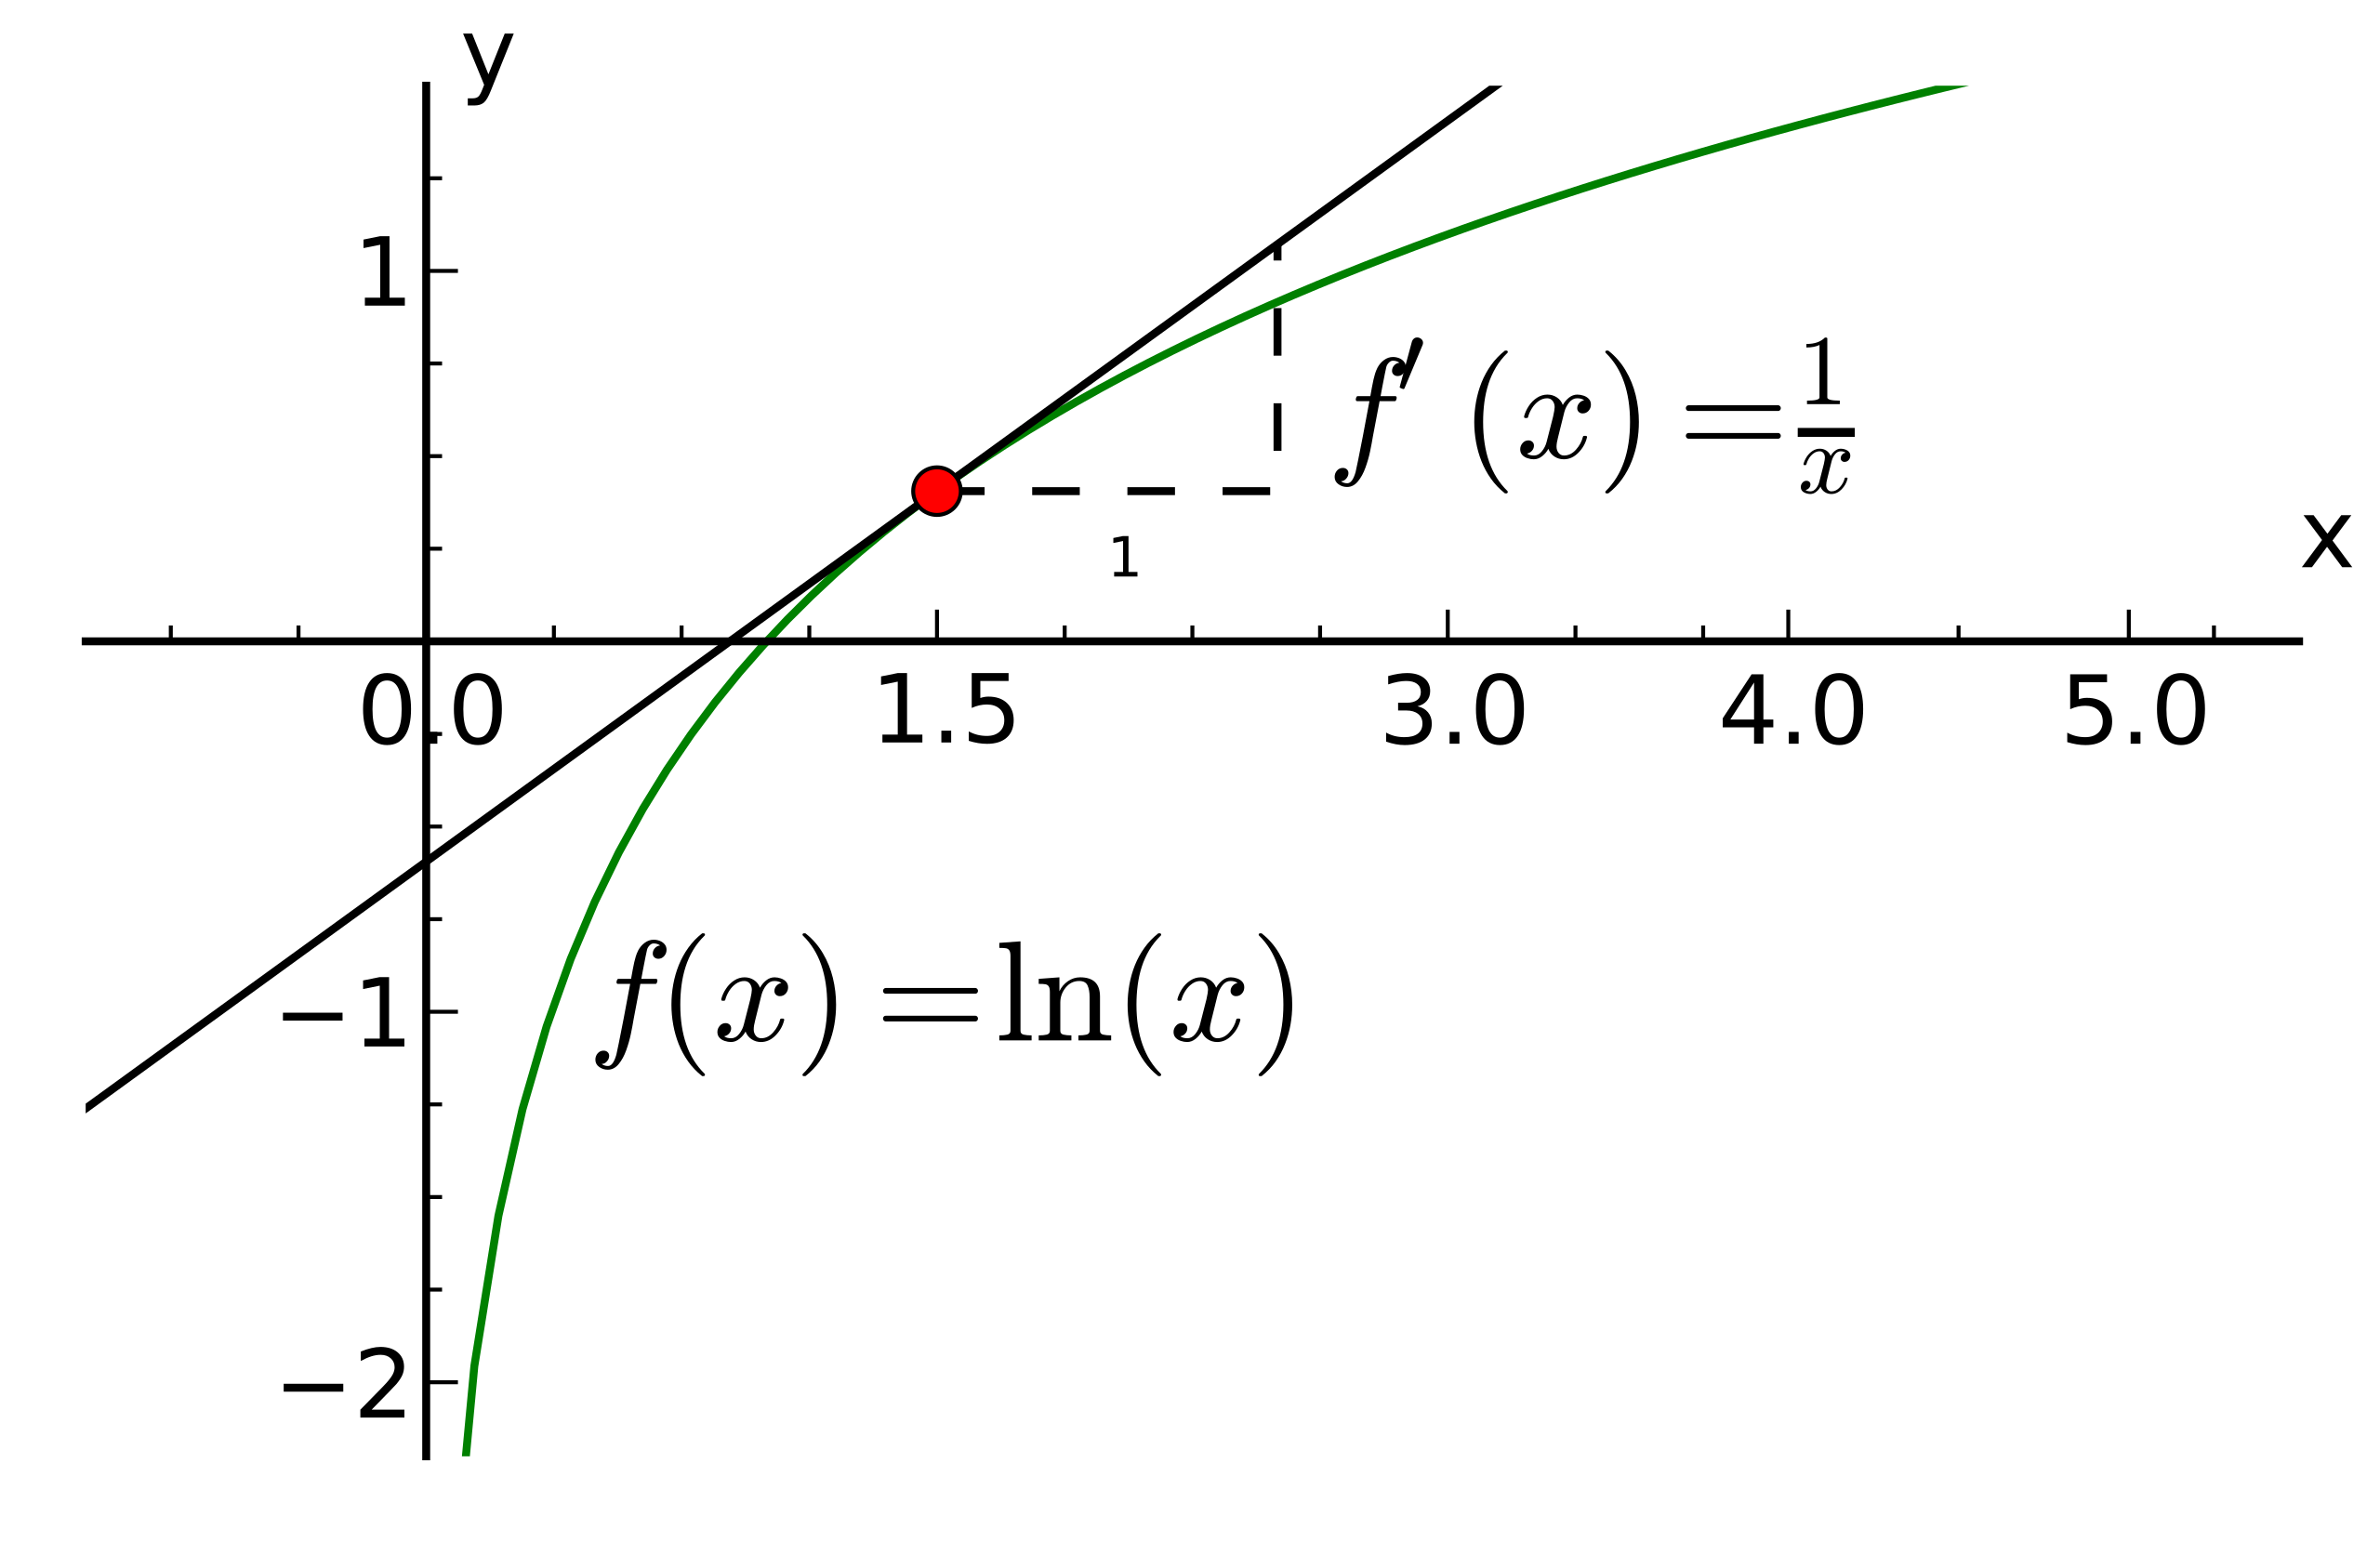
English: Graph of the logarithm and illustration of the derivative.
Created using python. from numpy import linspace,log
from matplotlib.pyplot import *
lineEQ = lambda k,a: log(a)+(k-a)/a
x1 = linspace(0,7,100)
y1 = log(x1)
x2 = linspace(-1.5,4,3)
y2 = lineEQ(x2,1.5)
x3 = [1.5,2.5,2.5]
y3 = [][0],1.5), lineEQ(x3[0],1.5), lineEQ(x3[1],1.5)]
fig = figure(figsize=(5,3))
ax = fig.add_subplot(111)
for direction in ["left","bottom"]:
ax.spines[direction].set_position('zero')
ax.spines[direction].set_smart_bounds(True)
for direction in ["right","top"]:
ax.spines[direction].set_color('none')
ax.xaxis.set_ticks_position('bottom')
ax.yaxis.set_ticks_position('left')
ax.grid(False)
ax.set_xticks([0,1.5,3,4,5])
ax.set_yticks([-2,-1,1])
ax.set_ylim(-2.2,1.5)
ax.set_xlim(-1,5.5)
ax.plot(x1,y1,'g',linewidth=1.)
ax.plot(x2,y2,'k',linewidth=1.)
ax.plot(x3,y3,'k--',linewidth=1.)
ax.plot(1.5,log(1.5),'ro')
ax.text(5.5,.2,"x")
ax.text(0.1,1.5,"y")
ax.text(4,1,r"$f(x)=\ln(x)$")
ax.text(2,.175,"1",fontsize=7)
ax.text(2.6,.5,r"$f^'(x)=\frac{1}{x}$",fontsize=12)
ax.minorticks_on()
#fig.show()
fig.savefig("Logarithm_derivative.svg",bbox_inches="tight",\
pad_inches=.15)
|
| 日期 | |
| 來源 | 自己的作品 |
| 作者 | Krishnavedala |
| 其他版本 | File:Logarithm_derivative.png |
W3C-validity not checked.
授權條款[編輯]
我,本作品的著作權持有者,決定用以下授權條款發佈本作品:
此檔案採用共享創意 姓名標示-相同方式分享 3.0 未在地化版本授權條款。
- 您可以自由:
- 分享 – 複製、發佈和傳播本作品
- 重新修改 – 創作演繹作品
- 惟需遵照下列條件:
- 姓名標示 – 您必須指名出正確的製作者,和提供授權條款的連結,以及表示是否有對內容上做出變更。您可以用任何合理的方式來行動,但不得以任何方式表明授權條款是對您許可或是由您所使用。
- 相同方式分享 – 如果您利用本素材進行再混合、轉換或創作,您必須基於如同原先的相同或兼容的條款,來分布您的貢獻成品。

|
已授權您依據自由軟體基金會發行的無固定段落、封面文字和封底文字GNU自由文件授權條款1.2版或任意後續版本,對本檔進行複製、傳播和/或修改。該協議的副本列在GNU自由文件授權條款中。 |
您可以選擇您需要的授權條款。
檔案歷史
點選日期/時間以檢視該時間的檔案版本。
| 日期/時間 | 縮圖 | 尺寸 | 用戶 | 備註 | |
|---|---|---|---|---|---|
| 目前 | 2011年6月5日 (日) 15:25 | | 375 × 243(44 KB) | JohnBlackburne(對話 | 貢獻) | Make text bigger and rearrange for readability |
| 2011年6月5日 (日) 11:44 |  | 375 × 243(32 KB) | Krishnavedala(對話 | 貢獻) | {{Information |Description ={{en|1=Graph of the logarithm and illustration of the derivative. Created using python. <source lang="python"> from numpy import linspace,log from matplotlib.pyplot import * lineEQ = la |
無法覆蓋此檔案。
檔案用途
下列頁面有用到此檔案:
全域檔案使用狀況
以下其他 wiki 使用了這個檔案:
- ast.wikipedia.org 的使用狀況
- bg.wikipedia.org 的使用狀況
- el.wikipedia.org 的使用狀況
- en.wikipedia.org 的使用狀況
- es.wikipedia.org 的使用狀況
- eu.wikipedia.org 的使用狀況
- fa.wikipedia.org 的使用狀況
- fa.wikibooks.org 的使用狀況
- hu.wikipedia.org 的使用狀況
- id.wikipedia.org 的使用狀況
- mk.wikipedia.org 的使用狀況
- pl.wikipedia.org 的使用狀況
- pt.wikipedia.org 的使用狀況
- ro.wikipedia.org 的使用狀況
- vi.wikipedia.org 的使用狀況
- vi.wikibooks.org 的使用狀況
- zh.wikipedia.org 的使用狀況