File:Map of the annual average discharge of Rhine and Maas 2000-2011 (EN).png
跳转到导航
跳转到搜索
本预览的尺寸:737 × 600像素。 其他分辨率:295 × 240像素 | 590 × 480像素 | 944 × 768像素 | 1,259 × 1,024像素 | 2,518 × 2,048像素 | 2,585 × 2,103像素。
原始文件 (2,585 × 2,103像素,文件大小:348 KB,MIME类型:image/png)
说明
说明
添加一行文字以描述该文件所表现的内容
| 描述 |
|
| 日期 | see file history |
| 来源 |
自己的作品, using
|
| 作者 | Maximilian Dörrbecker (Chumwa) |
| 授权 (二次使用本文件) |
我,本作品著作权人,特此采用以下许可协议发表本作品: 本文件采用知识共享署名-相同方式共享 2.5 通用许可协议授权。
Sie dürfen das Bild zu den folgenden Bedingungen nutzen:
|
| 其他版本 |
|
.png)
.png)
.png)
.png)


|
此map图片可使用矢量图形重新创建为SVG文件。这具有很多好处;更多信息请参见共享资源:待清理媒体。如果存在此图片的SVG格式,请将其上传,然后将此模板替换为
{{vector version available|新图片名称}}。
建议您将SVG命名为“Map of the annual average discharge of Rhine and Maas 2000-2011 (EN).svg”,这样在使用Vector version available(或Vva)模板时就不需要填写新图片名称参数。 |
文件历史
点击某个日期/时间查看对应时刻的文件。
| 日期/时间 | 缩略图 | 大小 | 用户 | 备注 | |
|---|---|---|---|---|---|
| 当前 | 2016年10月6日 (四) 23:08 | | 2,585 × 2,103(348 KB) | Cmdrjameson(留言 | 贡献) | Compressed with pngout. Reduced by 225kB (39% decrease). |
| 2016年3月5日 (六) 19:42 |  | 2,585 × 2,103(574 KB) | Chumwa(留言 | 贡献) | ||
| 2016年2月3日 (三) 19:03 |  | 3,589 × 2,919(840 KB) | Chumwa(留言 | 贡献) | ||
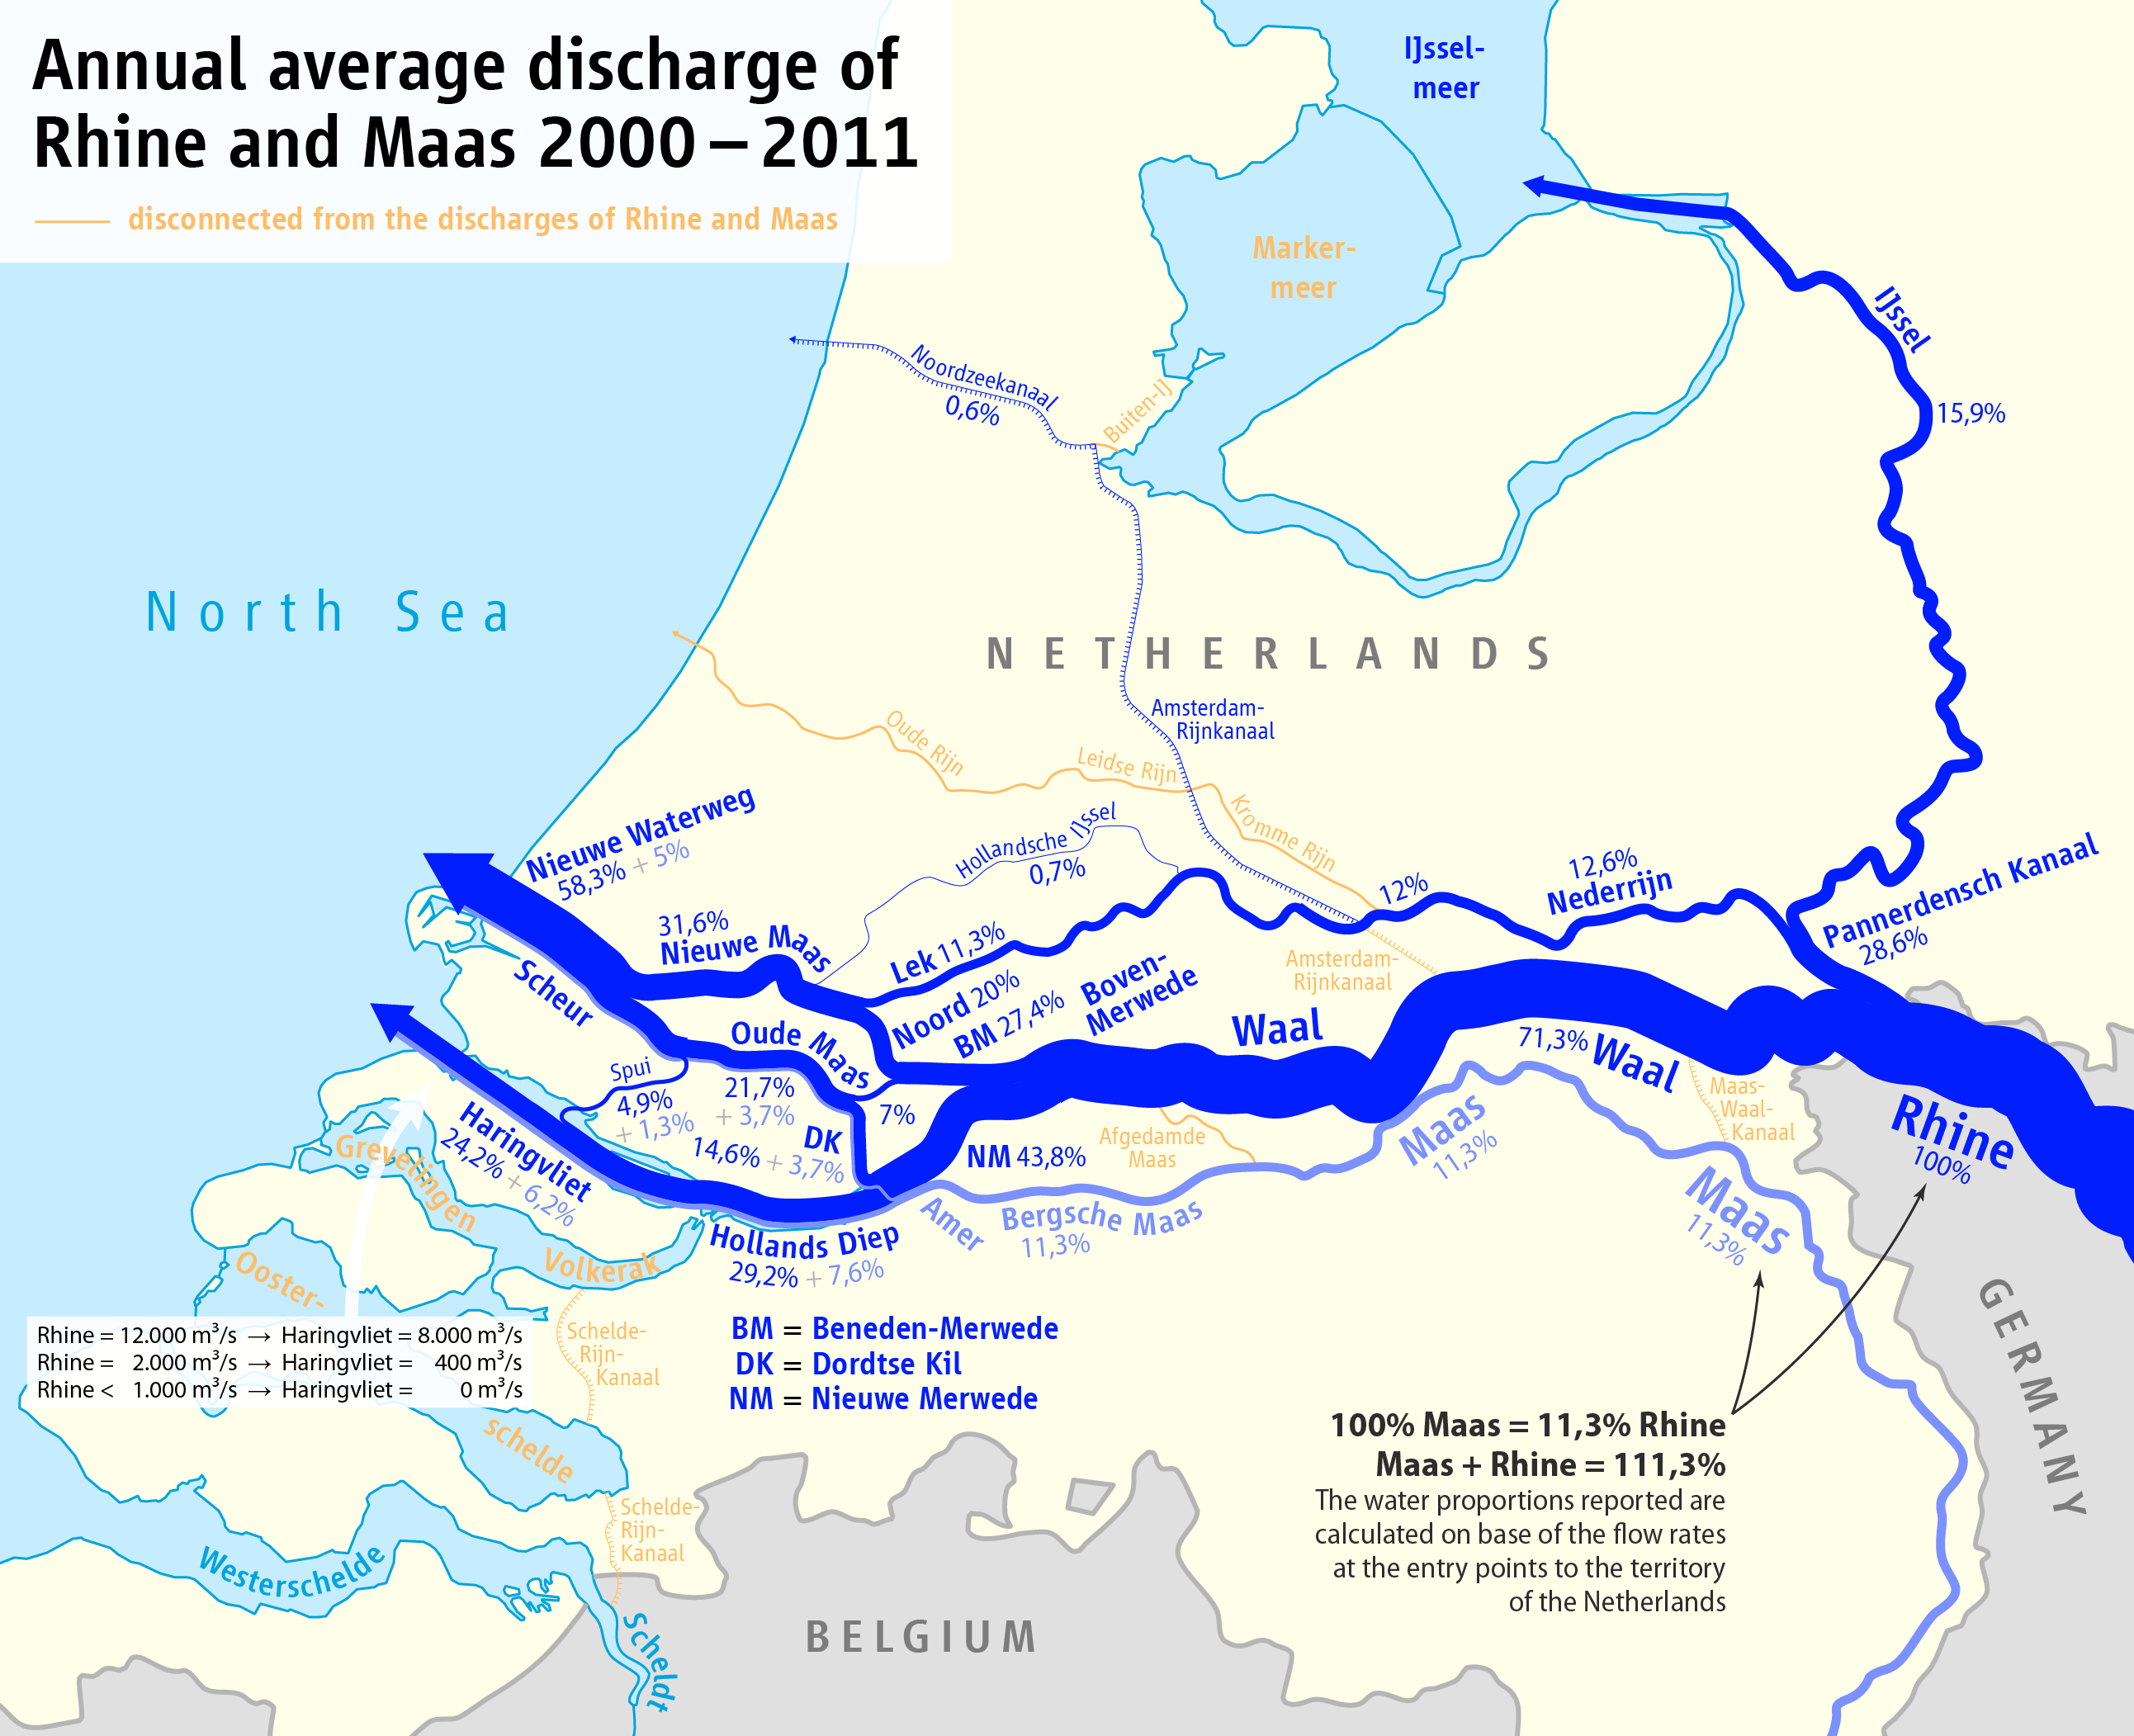
| 2016年2月3日 (三) 06:38 |  | 3,589 × 2,919(840 KB) | Chumwa(留言 | 贡献) | {{Information |Description= *{{de|Karte der Aufteilung der Abflüsse im Rhein-Maas-Delta 2000-2011}} *{{en|Map of the partition of Rhine and Meuse water among the various branches of their delta 2000-2011}} |Source={{Own}}, using * [[:File:Netherlands... |
您不可以覆盖此文件。
文件用途
以下11个页面使用本文件:
- Oppervlaktewater in Nederland
- User:Chumwa/Gallery
- User:Chumwa/OgreBot/Potential transport maps/2016 October 1-10
- User:Chumwa/OgreBot/Transport Maps/2016 March 1-10
- User:Chumwa/OgreBot/Transport Maps/2016 October 1-10
- User:Chumwa/OgreBot/Travel and communication maps/2016 March 1-10
- User:Chumwa/OgreBot/Travel and communication maps/2016 October 1-10
- File:Map of the annual average discharge of Rhine and Maas 2000-2011 (DE).png
- File:Map of the annual average discharge of Rhine and Maas 2000-2011 (EN).png
- File:Map of the annual average discharge of Rhine and Maas 2000-2011 (FR).png
- File:Map of the annual average discharge of Rhine and Maas 2000-2011 (NL).png
全域文件用途
以下其他wiki使用此文件:
- bg.wikipedia.org上的用途
- da.wikipedia.org上的用途
- de.wikipedia.org上的用途
- en.wikipedia.org上的用途
- en.wiktionary.org上的用途
- es.wikipedia.org上的用途
- eu.wikipedia.org上的用途
- fr.wikipedia.org上的用途
- id.wikipedia.org上的用途
- it.wikipedia.org上的用途
- ru.wikipedia.org上的用途
- sl.wikipedia.org上的用途
- sv.wikipedia.org上的用途
- tr.wikipedia.org上的用途
- uk.wikipedia.org上的用途
- vep.wikipedia.org上的用途
- zh.wikipedia.org上的用途
.png&oldid=776152986)