File:NASA Summer 2023 Temperature Media Resources (SVS14407 - Agu23Vert Draft3).webm
Jump to navigation
Jump to search
Size of this JPG preview of this WEBM file: 337 × 599 pixels. Other resolutions: 135 × 240 pixels | 270 × 480 pixels | 432 × 768 pixels | 1,080 × 1,920 pixels.
Original file (WebM audio/video file, VP8/Opus, length 16 s, 1,080 × 1,920 pixels, 1.07 Mbps overall, file size: 2 MB)
Captions
Captions
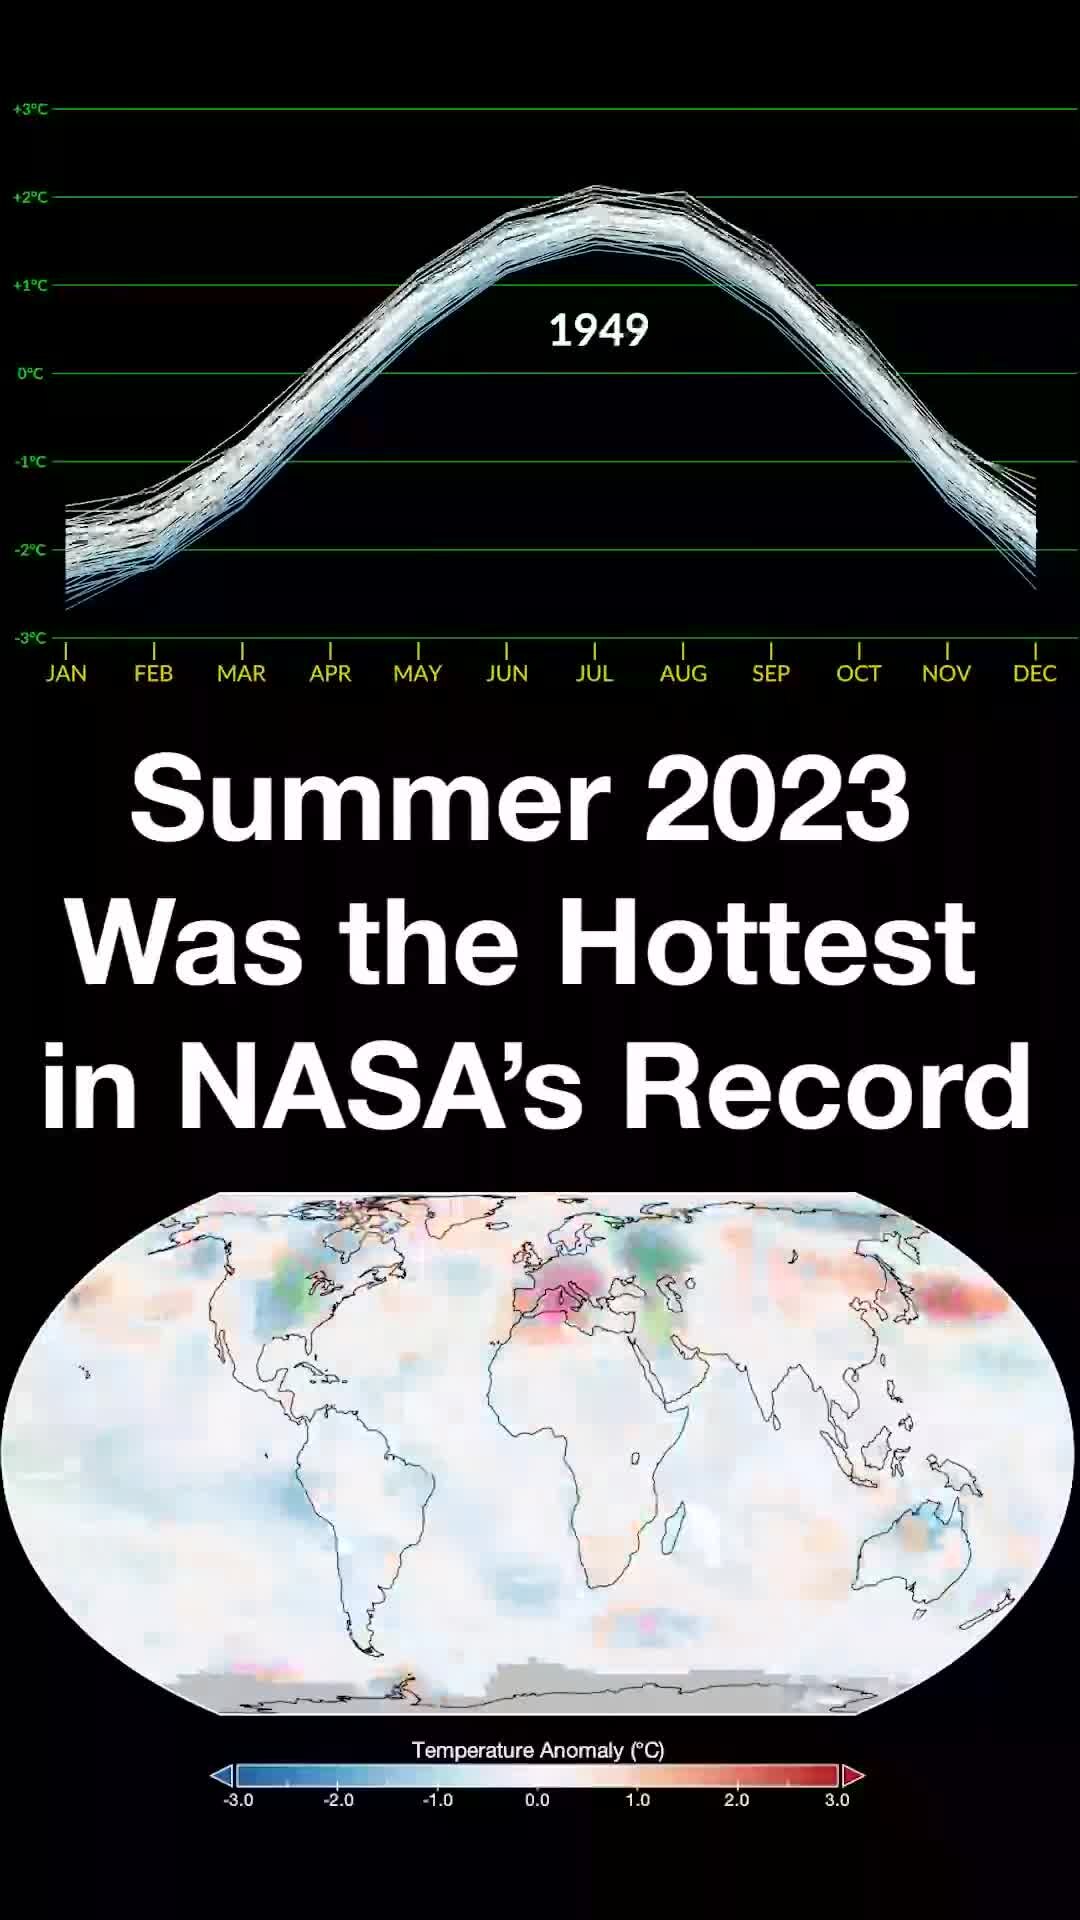
Two stacked data visualizations. Between them, white text reads “Summer 2023 Was the Hottest in NASA’s Record.
Summary
[edit]| Description |
English: Two stacked data visualizations. Between them, white text reads “Summer 2023 Was the Hottest in NASA’s Record.” On top, a line graph with monthly temperature anomalies from each year from 1880 to 2023 grows across the graph to create a stacked bell shape. The Y-axis is labeled negative 3 degrees Celsius to 3 degrees Celsius and the X-axis has each month from January to December. As time goes on, the curved lines stack higher and higher, and the colors of the lines change from white and blue to dark red. Finally, the 2023 line stops at August, the latest month we have data, and it’s clear that June, July, & August 2023 were all hotter than any previous respective month. On the bottom, a map of the globe with temperature anomalies in Celsius. Anomalies up to 3 degrees higher than average are shown in red. Anomalies up to 3 degrees lower than average are shown in blue. The animation shows August temperature anomalies starting in 1880 through 2023. As the animation plays, various areas are red or blue. By the end, nearly everywhere on Earth is some shade of red except for some places in the Antarctic.Complete transcript available. |
| Date | 14 September 2023 (upload date) |
| Source | NASA Summer 2023 Temperature Media Resources |
| Author | NASA's Scientific Visualization Studio - Lauren Dauphin, Mark SubbaRao, Peter H. Jacobs, Jenny Marder Fadoul, Emily Furfaro, Grace Weikert, Jessica Wilde, Katie Jepson, Scott Bednar, Jocelyn Argueta, Kathryn Mersmann, Sofie Bates |
| Other versions |
|
| Keywords | Temperature Anomalies; Atmospheric Temperature; HDTV; Earth Science; Climate; Atmosphere; Temperature; Atmospheric science; Temperature Trend |
.jpg)
.jpg)
.gif)
.jpg)
Licensing
[edit]| This file is in the public domain in the United States because it was solely created by NASA. NASA copyright policy states that "NASA material is not protected by copyright unless noted". (See Template:PD-USGov, NASA copyright policy page or JPL Image Use Policy.) | ||
 |
Warnings:
|
File history
Click on a date/time to view the file as it appeared at that time.
| Date/Time | Thumbnail | Dimensions | User | Comment | |
|---|---|---|---|---|---|
| current | 14:19, 20 January 2024 | 16 s, 1,080 × 1,920 (2 MB) | OptimusPrimeBot (talk | contribs) | #Spacemedia - Upload of https://svs.gsfc.nasa.gov/vis/a010000/a014400/a014407/Agu23Vert_Draft3.webm via Commons:Spacemedia |
You cannot overwrite this file.
File usage on Commons
The following 13 pages use this file:
- File:NASA Summer 2023 Temperature Media Resources (SVS14407).gif
- File:NASA Summer 2023 Temperature Media Resources (SVS14407 - Aug23Vert2 Draft3).webm
- File:NASA Summer 2023 Temperature Media Resources (SVS14407 - DrGavinA Schmidt Remote Interview GTR 2023).webm
- File:NASA Summer 2023 Temperature Media Resources (SVS14407 - GISTEMP).webm
- File:NASA Summer 2023 Temperature Media Resources (SVS14407 - GISTEMP Curves Aug2023 English degC 2160p60).webm
- File:NASA Summer 2023 Temperature Media Resources (SVS14407 - GISTEMP Spiral Aug2023 English degC 2160p60).webm
- File:NASA Summer 2023 Temperature Media Resources (SVS14407 - GISTEMP Summer2023 English 2160p30).webm
- File:NASA Summer 2023 Temperature Media Resources (SVS14407 - How Do We Know What Earths Climate Was Like Long Ago - Horizontal Video).webm
- File:NASA Summer 2023 Temperature Media Resources (SVS14407 - Is Climate Change the Same as Global Warming - Horizontal Video).webm
- File:NASA Summer 2023 Temperature Media Resources (SVS14407 - Title).jpg
- File:NASA Summer 2023 Temperature Media Resources (SVS14407 - Why Does Climate Change Matter - Horizontal Video).webm
- File:NASA Summer 2023 Temperature Media Resources (SVS14407 - globaljja gis 2023).jpg
- File:NASA Summer 2023 Temperature Media Resources (SVS14407 - globaljjaanoms gis 2023 chart lrg).jpg