File:Nyquist example.svg
跳转到导航
跳转到搜索

此SVG文件的PNG预览的大小:443 × 428像素。 其他分辨率:248 × 240像素 | 497 × 480像素 | 795 × 768像素 | 1,060 × 1,024像素 | 2,120 × 2,048像素。
原始文件 (SVG文件,尺寸为443 × 428像素,文件大小:53 KB)
说明
说明
添加一行文字以描述该文件所表现的内容
摘要
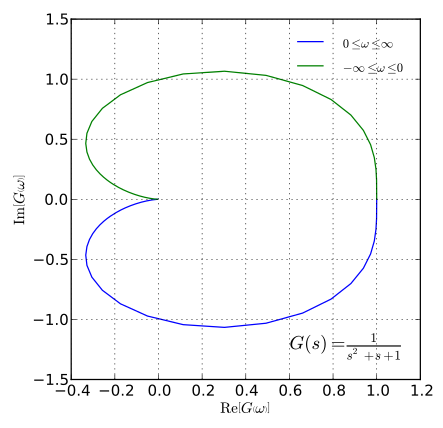
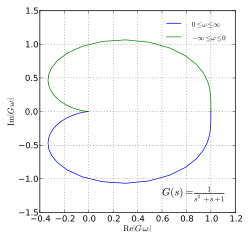
[编辑]| 描述 | The Nyquist Plot for a sample function that can be converted to frequency by replacing with (imaginary frequency) and . Created using Python and matplotlib. |
| 日期 | |
| 来源 | 自己的作品 |
| 作者 | Utkarsh Upadhyay,--Krishnavedala (talk) 20:21, 3 June 2011 (UTC) (python version) |
| 授权 (二次使用本文件) |
Public Domain |


W3C-validity not checked.
| Source Code |
|---|
from numpy import *
from matplotlib.pyplot import *

def nyquist(w):		# compute the complex Nyquist response
	s = complex(0,w)
	return (1/(s**2+s+1))

fig = figure(figsize=(5,5))
ax = fig.add_subplot(111)
ax.grid(True)

t, N = linspace(0,5*pi,200), [] # 5*pi is approx. to infinity.
for i in t:			# compute the complex response for +ve omega
	N = append(N,nyquist(i))
ax.plot(real(N),imag(N),label=r"$0\leq\omega\leq\infty$")
t, N = linspace(-5*pi,0,200), []
for i in t:			# compute the complex response for -ve omega
	N = append(N,nyquist(i))
ax.plot(real(N),imag(N),label=r"$-\infty\leq\omega\leq 0$")
ax.legend(frameon=False)
setp(ax.get_legend().get_texts(),fontsize='small')
ax.set_xlabel(r"$\mathrm{Re}\left[G\left(\omega\right)\right]$")
ax.set_ylabel(r"$\mathrm{Im}\left[G\left(\omega\right)\right]$")
ax.text(0.6,-1.25,r"$G(s)=\frac{1}{s^2+s+1}$",\
	fontsize=15)

#fig.show()
fig.savefig("Nyquist example.svg",bbox_inches="tight",\
	pad_inches=.15)
|
许可协议
[编辑]
| 我,本作品著作权人,释出本作品至公有领域。这适用于全世界。 在一些国家这可能不合法;如果是这样的话,那么: 我无条件地授予任何人以任何目的使用本作品的权利,除非这些条件是法律规定所必需的。 |
文件历史
点击某个日期/时间查看对应时刻的文件。
| 日期/时间 | 缩略图 | 大小 | 用户 | 备注 | |
|---|---|---|---|---|---|
| 当前 | 2011年6月3日 (五) 20:10 | | 443 × 428(53 KB) | Krishnavedala(留言 | 贡献) | corrected the equation in the curve |
| 2011年6月3日 (五) 20:04 |  | 443 × 428(53 KB) | Krishnavedala(留言 | 贡献) | a well defined curve | |
| 2010年7月1日 (四) 20:55 |  | 1,000 × 1,000(7 KB) | DieBucheBot(留言 | 贡献) | Trying to fix SVG using scour | |
| 2007年3月27日 (二) 02:36 |  | 1,000 × 1,000(11 KB) | Musically ut(留言 | 贡献) | {{Information |Description=The Nyquist Plot for a sample function. |Source=Octave and GNU Plot |Date=27/03/06 |Author=Utkarsh Upadhyay |Permission=Public Domain |other_versions= - }} |
您不可以覆盖此文件。
文件用途
以下2个页面使用本文件:
全域文件用途
以下其他wiki使用此文件:
- en.wikipedia.org上的用途
- fa.wikipedia.org上的用途
- fr.wikipedia.org上的用途
- hi.wikipedia.org上的用途
- it.wikipedia.org上的用途
- pt.wikipedia.org上的用途
- tr.wikipedia.org上的用途
- vi.wikipedia.org上的用途
- zh.wikipedia.org上的用途