File:Oil consumption per day by region from 1980 to 2006.svg
跳转到导航
跳转到搜索

此SVG文件的PNG预览的大小:600 × 450像素。 其他分辨率:320 × 240像素 | 640 × 480像素 | 1,024 × 768像素 | 1,280 × 960像素 | 2,560 × 1,920像素。
原始文件 (SVG文件,尺寸为600 × 450像素,文件大小:204 KB)
说明
说明
添加一行文字以描述该文件所表现的内容
| 描述 |
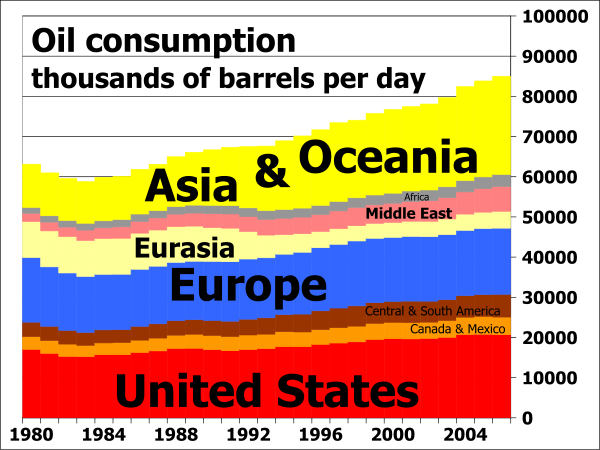
English: Oil consumption in daily barrels per region from 1980 to 2006; vertical extents indicate barrels of oil consumed per day, and the horizontal scale shows years from 1980 to 2007. |
| 日期 | |
| 来源 |
I, 84user, created this work using the excel file RecentPetroleumConsumptionBarrelsperDay.xls from the U.S. Energy Information Administration's web page http://tonto.eia.doe.gov/dnav/pet/pet_pri_wco_k_w.htm (direct link: http://www.eia.doe.gov/emeu/international/RecentPetroleumConsumptionBarrelsperDay.xls) and using Open Source Gnumeric 1.9.1 to produce the chart. See also  |
| 作者 | 84user |
| 授权 (二次使用本文件) |
PD-SELF; Released into the public domain (by the author). |
| 其他版本 |
 |
See also[编辑]


许可协议[编辑]
| 本作品已被作者84user释出到公有领域。这适用于全世界。 在一些国家这可能不合法;如果是这样的话,那么: |
文件历史
点击某个日期/时间查看对应时刻的文件。
| 日期/时间 | 缩略图 | 大小 | 用户 | 备注 | |
|---|---|---|---|---|---|
| 当前 | 2008年10月25日 (六) 14:52 | | 600 × 450(204 KB) | 84user(留言 | 贡献) | increased main title font size |
| 2008年10月25日 (六) 14:31 |  | 600 × 450(195 KB) | 84user(留言 | 贡献) | {{Information |Description={{en|Oil consumption in daily barrels per region from 1980 to 2006; vertical extents indicate barrels of oil consumed per day, and the horizontal scale shows years from 1980 to 2007.}} |Source=I, 84user, created this work using |
您不可以覆盖此文件。
文件用途
以下3个页面使用本文件:
全域文件用途
以下其他wiki使用此文件:
- en.wikipedia.org上的用途
- es.wikipedia.org上的用途
- fa.wikipedia.org上的用途
- id.wikipedia.org上的用途
- ko.wikipedia.org上的用途
- th.wikipedia.org上的用途
- ur.wikipedia.org上的用途