File:Ontwikkeling schaatstijden over 10km.png
Jump to navigation
Jump to search

Size of this preview: 800 × 522 pixels. Other resolutions: 320 × 209 pixels | 640 × 417 pixels | 1,024 × 668 pixels | 1,360 × 887 pixels.
Original file (1,360 × 887 pixels, file size: 66 KB, MIME type: image/png)
Captions
Captions
Add a one-line explanation of what this file represents
Summary
[edit]
| Description |
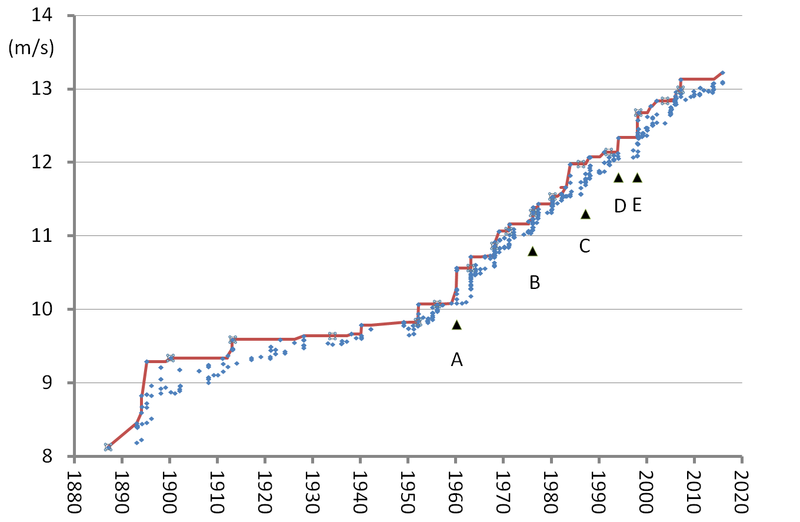
Nederlands: Ontwikkeling schaatssnelheid over 10 km.
De snelheid van de topschaatsers over de 10.000 meters in meter/seconde is uitgezet tegen de jaren. De rode lijn is de wereldrecordsnelheid. De blauwe punten zijn de beste snelheden per seizoen.
English: Development of skating speed over 10.000 m.
The speed of top skaters over 10.000 meters is displayed over the years. The red line is de world record speed. The blue dots are various best times per season.
|
| Date | between 2005 and 2011 |
| Source | Own work |
| Author | Jan Arkesteijn |
Licensing
[edit]
| This work has been released into the public domain by its author, Jan Arkesteijn at Dutch Wikipedia. This applies worldwide. In some countries this may not be legally possible; if so: Jan Arkesteijn grants anyone the right to use this work for any purpose, without any conditions, unless such conditions are required by law. |
File history
Click on a date/time to view the file as it appeared at that time.
| Date/Time | Thumbnail | Dimensions | User | Comment | |
|---|---|---|---|---|---|
| current | 17:31, 22 November 2015 | | 1,360 × 887 (66 KB) | Jan Arkesteijn (talk | contribs) | updated |
| 13:40, 23 February 2014 |  | 1,367 × 893 (60 KB) | Jan Arkesteijn (talk | contribs) | updated graph | |
| 16:14, 12 January 2012 |  | 1,367 × 893 (57 KB) | Jan Arkesteijn (talk | contribs) | updated graph | |
| 08:41, 23 March 2010 |  | 1,141 × 826 (53 KB) | Jan Arkesteijn (talk | contribs) | formatted | |
| 23:48, 22 March 2010 |  | 1,141 × 825 (48 KB) | Jan Arkesteijn (talk | contribs) | Language neutral version, season 2009/2010 include | |
| 09:50, 3 July 2009 |  | 446 × 330 (11 KB) | Jan Arkesteijn (talk | contribs) | +seizoen 2009 | |
| 08:55, 31 October 2008 |  | 446 × 330 (15 KB) | Jan Arkesteijn (talk | contribs) | +seizoen 2007/2008 | |
| 21:17, 11 April 2007 |  | 441 × 325 (9 KB) | SieBot (talk | contribs) | {{Information |Description=Onwikkeling schaatstijden over 10 km. Grafiek vervaardigd op basis van cijfers van [http://web.telia.com/~u46130641/d10k.htm Evert Stenlund] |Source=Originally from [http://nl.wikipedia.org nl.wikipedia]; description page is/wa |
You cannot overwrite this file.
File usage on Commons
There are no pages that use this file.
File usage on other wikis
The following other wikis use this file:
- Usage on de.wikipedia.org
- Usage on nl.wikipedia.org