File:PapayaYield.png
跳至導覽
跳至搜尋

預覽大小:800 × 488 像素。 其他解析度:320 × 195 像素 | 640 × 390 像素 | 1,024 × 624 像素 | 1,490 × 908 像素。
原始檔案 (1,490 × 908 像素,檔案大小:471 KB,MIME 類型:image/png)
說明
說明
添加單行說明來描述出檔案所代表的內容
摘要
[編輯]
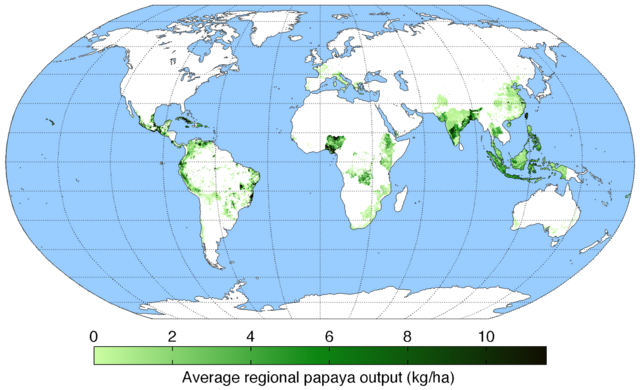
| 描述 | Map of papaya production (average percentage of land used for its production times average yield in each grid cell) across the world compiled by the University of Minnesota Institute on the Environment with data from: Monfreda, C., N. Ramankutty, and J.A. Foley. 2008. Farming the planet: 2. Geographic distribution of crop areas, yields, physiological types, and net primary production in the year 2000. Global Biogeochemical Cycles 22: GB1022 |
| 日期 | |
| 來源 | 自己的作品 |
| 作者 | AndrewMT |
授權條款
[編輯]
我,本作品的著作權持有者,決定用以下授權條款發佈本作品:
此檔案採用創用CC 姓名標示-相同方式分享 3.0 未在地化版本授權條款。
- 您可以自由:
- 分享 – 複製、發佈和傳播本作品
- 重新修改 – 創作演繹作品
- 惟需遵照下列條件:
- 姓名標示 – 您必須指名出正確的製作者,和提供授權條款的連結,以及表示是否有對內容上做出變更。您可以用任何合理的方式來行動,但不得以任何方式表明授權條款是對您許可或是由您所使用。
- 相同方式分享 – 如果您利用本素材進行再混合、轉換或創作,您必須基於如同原先的相同或兼容的條款,來分布您的貢獻成品。
檔案歷史
點選日期/時間以檢視該時間的檔案版本。
| 日期/時間 | 縮圖 | 尺寸 | 使用者 | 備註 | |
|---|---|---|---|---|---|
| 目前 | 2010年12月3日 (五) 14:39 | | 1,490 × 908(471 KB) | Ras67(留言 | 貢獻) | cropped and transparent background |
| 2010年5月12日 (三) 20:51 |  | 1,600 × 960(487 KB) | AndrewMT(留言 | 貢獻) | Bigger resolution Category:Papaya Category:Crops Category:Maps | |
| 2010年3月10日 (三) 20:16 |  | 800 × 500(187 KB) | AndrewMT(留言 | 貢獻) | {{Information |Description={{en|1=Map of pea yield across the world (kg/ha) compiled by the University of Minnesota Institute on the Environment with data from:<br> Monfreda, C., N. Ramankutty, and J.A. Foley. 2008. Farming the planet: 2. Geographic distr |
無法覆蓋此檔案。
檔案用途
沒有使用此檔案的頁面。
全域檔案使用狀況
以下其他 wiki 使用了這個檔案: