File:Periodic points of f(z) = z*z-0.75 for period =6 as intersections of 2 implicit curves.svg
Μετάβαση στην πλοήγηση
Πήδηση στην αναζήτηση

Το μέγεθος αυτής της PNG προεπισκόπησης αυτού του SVG το αρχείο: 600 × 600 εικονοστοιχεία. Άλλες αναλύσεις: 240 × 240 εικονοστοιχεία | 480 × 480 εικονοστοιχεία | 768 × 768 εικονοστοιχεία | 1.024 × 1.024 εικονοστοιχεία | 2.048 × 2.048 εικονοστοιχεία | 1.000 × 1.000 εικονοστοιχεία.
Πρωτότυπο αρχείο (Αρχείο SVG, ονομαστικό μέγεθος 1.000 × 1.000 εικονοστοιχεία, μέγεθος αρχείου: 2,28 MB)
Λεζάντες
Λεζάντες
Δεν ορίστηκε λεζάντα
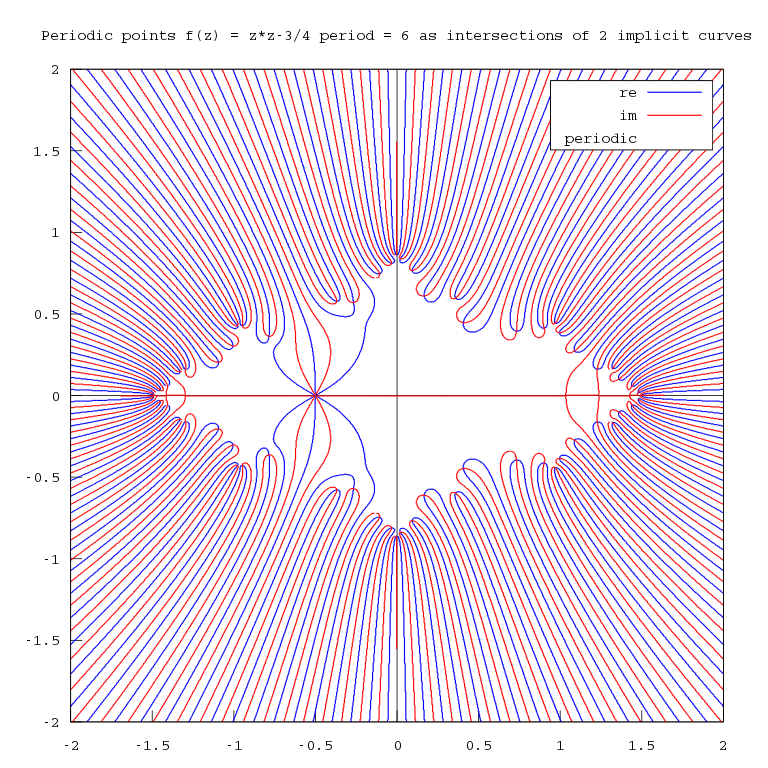
Periodic points of f(z) = z*z-0.75 for period =6 as intersections of 2 implicit curves
Σύνοψη
[επεξεργασία]| Περιγραφή |
English: Periodic points of f(z) = z*z-0.75 for period =6 as intersections of 2 implicit curves "(which are related by the Cauchy-Riemann equations) separately. Their intersections give the complex roots of the original function. "[1] |
| Ημερομηνία | |
| Πηγή | Έργο αυτού που το ανεβάζει |
| Δημιουργός | Adam majewski |
| άλλες εκδόσεις |
|
| SVG ανάπτυξη | W3C-invalid Αυτή η διανυσματική εικόνα δημιουργήθηκε με Gnuplot This plot uses embedded text that can be easily translated using a text editor. |
_%3D_z*z-0.75_for_period_%3D4_as_intersections_of_2_implicit_curves.svg)
_%3D_z*z-0.75_for_period_%3D3_as_intersections_of_2_implicit_curves.png)

_%3D_z*z-0.75_for_period_%3D6_as_intersections_of_2_implicit_curves.svg&action=edit§ion=1)
Αδειοδότηση
[επεξεργασία]_%3D_z*z-0.75_for_period_%3D6_as_intersections_of_2_implicit_curves.svg&action=edit§ion=2)
Εγώ, ο κάτοχος των πνευματικών δικαιωμάτων αυτού του έργου, το δημοσιεύω δια του παρόντος υπό την εξής άδεια χρήσης:
Το αρχείο διανέμεται υπό την άδεια Creative Commons Αναφορά προέλευσης-Παρόμοια διανομή 4.0 Διεθνής
- Είστε ελεύθερος:
- να μοιραστείτε – να αντιγράψετε, διανέμετε και να μεταδώσετε το έργο
- να διασκευάσετε – να τροποποιήσετε το έργο
- Υπό τις ακόλουθες προϋποθέσεις:
- αναφορά προέλευσης – Θα πρέπει να κάνετε κατάλληλη αναφορά, να παρέχετε σύνδεσμο για την άδεια και να επισημάνετε εάν έγιναν αλλαγές. Μπορείτε να το κάνετε με οποιοδήποτε αιτιολογήσιμο λόγο, χωρίς όμως να εννοείται με οποιονδήποτε τρόπο ότι εγκρίνουν εσάς ή τη χρήση του έργου από εσάς.
- παρόμοια διανομή – Εάν αλλάξετε, τροποποιήσετε ή δημιουργήσετε πάνω στο έργο αυτό, μπορείτε να διανείμετε αυτό που θα προκύψει μόνο υπό τους όρους της ίδιας ή συμβατής άδειας με το πρωτότυπο.
Maxima CAS src code
[επεξεργασία]_%3D_z*z-0.75_for_period_%3D6_as_intersections_of_2_implicit_curves.svg&action=edit§ion=3)
/*

find periodic points of f^n(z,c)
zn = z0


A useful way to visualize the roots of a complex function is to plot the 0 contours of the real and imaginary parts. That is, compute z = Dm(...) on a reasonably dense grid, and then use matplotlib's contour function to plot the contours where z.real is 0 and where z.imag is zero. The roots of the function are the points where these contours intersect.
Warren Weckesser

https://stackoverflow.com/questions/24419164/storing-roots-of-a-complex-function-in-an-array-in-scipy/24421779#24421779


*/

kill(all);
remvalue(all);
ratprint:false;
numer:true$
display2d:false$


declare (z, complex)$
declare ([x,y], real)$
z:x+y*%i;


/* -------------------functions --------------------------------------*/
f(z):= z*z+c$ /* complex quadratic polynomial */

/* iterated function */
fn(n, z) :=
  if n=0
  	then z
  	else 	(if n=1
  			then f(z)
  			else f(fn(n-1, z))
  		)$

/* for periodic points {z: zp=z0 }*/
Fn(n,z) := fn(n, z) - z$

/*
converts complex number z = x*y*%i
to the list in a draw format:
[x,y]
*/
dr(z):=[float(realpart(z)), float(imagpart(z))]$

ToPoints(myList):= points(map(dr,myList))$

compile(all)$


/* constants */
period :4$

c:-3/4$


/* ------------------ computations ---------------------------------------*/
zp:  Fn(period, z)$
e1: realpart(zp )=0$
e2: imagpart(zp )=0$

/*
find periodic points using numerical method
*/
polyfactor:false$
if ( period < 6) /* allroots fails for period >5 */
	then sol: allroots(%i*Fn(period, w))
	else ( /* increase precision of numerical computations */
		print("bfloat"),
		fpprec : 32, /*Default value: 16, it is the number of significant digits for arithmetic on bigfloat numbers */
		float2bf : true,
		sol: bfallroots(%i*Fn(period, bfloat(w) ))

		)$

sol: map(rhs,sol)$
intersections:ToPoints(sol)$


dSize : 2$ /* image size in world coordinate =  x, -dSize,dSize, y, -dSize,dSize), */
path:"~/Dokumenty/newton/2/"$ /*  pwd, if empty then file is in a home dir , path should end with "/" */

/* draw it using draw package ( Maxima-Gnuplot interface) by Mario Rodríguez Riotorto */
draw2d(
	file_name = sconcat(path, string(period)),
	terminal   = svg,
	dimensions = [1000,1000],
	/* the text */
  	color     = black,
  	font      = "Courier",
  	font_size = 20,
	title = sconcat("Periodic points f(z) = z*z-3/4 period = ", string(period), " as intersections of 2 implicit curves"),
	user_preamble = "set key box opaque ", /* legend ovelaps the graph */
  	/* */
  	grid       = false,
  	xaxis = false,
  	yaxis = false,
  	xaxis_type  = solid,
  	yaxis_type  = solid,
  	xaxis_color = black,
  	yaxis_color = black,
  	proportional_axes = xy,

  	/* implicit curves */
  	ip_grid = [200, 200], /* precision and time of computations for implicit curves */
  	line_width = 1.5,
  	line_type = solid,
  	/* first curve */
  	key        = "re",
  	color = blue,
  	implicit(e1, x, -dSize,dSize, y, -dSize,dSize),
  	/* second curve */
  	color      = red,
  	key        = "im",
  	implicit(e2, x, -dSize,dSize, y, -dSize,dSize),
  	/* points */
  	point_type= filled_circle,
  	point_size = 0.5,
  	color= black,
  	key = "periodic",
  	intersections

   ) $
Ιστορικό αρχείου
Πατήστε σε μια ημερομηνία/ώρα για να δείτε το αρχείο όπως εμφανιζόταν εκείνη την χρονική στιγμή.
| Ημερομηνία/Ώρα | Μικρογραφία | Διαστάσεις | Χρήστης | Σχόλιο | |
|---|---|---|---|---|---|
| τρέχον | 10:31, 27 Δεκεμβρίου 2020 | | 1.000 × 1.000 (2,28 MB) | Soul windsurfer (συζήτηση | Συνεισφορά) | Uploaded own work with UploadWizard |
Δεν μπορείτε να αντικαταστήσετε αυτό το αρχείο.
Χρήση αρχείου
Οι ακόλουθες 2 σελίδες χρησιμοποιούν προς αυτό το αρχείο:
Καθολική χρήση αρχείου
Τα ακόλουθα άλλα wiki χρησιμοποιούν αυτό το αρχείο:
- Χρήση σε el.wikipedia.org
- Χρήση σε en.wikipedia.org
- Χρήση σε en.wikibooks.org
_%3D_z*z-0.75_for_period_%3D6_as_intersections_of_2_implicit_curves.svg&oldid=804911652)