File:Polarisation (Linear).svg

Algfail (SVG-fail, algsuurus 250 × 625 pikslit, faili suurus: 11 KB)
Pealdised
Pealdised
| Kirjeldus |
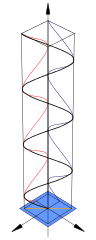
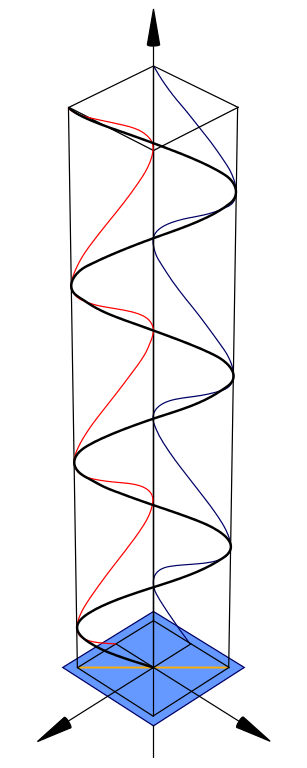
Diagram of linear polarisation. The direction of the black line relative to the central axis represents the direction of the electric field of the linearly polarized light at each point in space. The blue and red lines are projections of the black onto two planes which are at right angles. There is an version which is identical to this original with the exception of phase indictors to make the phase relationship of its components clearer. Refer to Other Versions section below. |
||
| Kuupäev | 12/02/07 | ||
| Allikas |
Own drawing down in Mathematica, edited in the Open Source program Inscape. See vektorkujutis on valmistatud rakendusega Inkscape . |
||
| Autor | inductiveload | ||
| Luba (Faili edasikasutus) |
|
||
| Teised versioonid |
Derivative works of this file: Polarisation (Linear) With.Phase.Indicators.svg Circular polarisation Elliptical polarisation |
_With.Phase.Indicators.svg)
.svg)
.svg)
Mathematica Code[muuda]
.svg&action=edit§ion=1)
This figure requires the use of Arrow3D, which is not included in the StandardPackages (as of Feb 2007). This can be obtained from Wolfram Research at this location. The required packages are:
<< Graphics`
<< Arrow3D`Arrow3D`
The code is:
wavefunction=ParametricPlot3D[{Sin[4t],-Sin[4t],t},{t,0,5},
    BoxRatios\[Rule]{1,
      1,4},ImageSize\[Rule]400,Boxed\[Rule]False,Axes\[Rule]False,
      PlotPoints\[Rule]60,ViewPoint->{2,2, 2},PlotRange\[Rule]All]

repsi=ParametricPlot3D[{Sin[4t],-1,t,RGBColor[1,0,0]},{t,0,5},
      BoxRatios\[Rule]{4,1,1},ImageSize\[Rule]500,
      Boxed\[Rule]False,Axes\[Rule]False,
        PlotPoints\[Rule]60,PlotRange\[Rule]All]

impsi=ParametricPlot3D[{-1,-Sin[4t],t,RGBColor[0,0,102/255]},{
    t,0,5},BoxRatios\[Rule]{4,1,1},ImageSize\[Rule]500,Boxed\[Rule]False,
      Axes\[Rule]False,PlotPoints\[Rule]60,PlotRange\[Rule]All]

end=ParametricPlot3D[{Sin[t],-Sin[t],0},{t,0,2π},BoxRatios\[Rule]{4,1,1},
    ImageSize\[Rule]500,Boxed\[Rule]False,Axes\[Rule]False,
      PlotPoints\[Rule]10,PlotRange\[Rule]All]

xaxis=Graphics3D[Arrow3D[{0,0,-1},{
  0,0,6},HeadSize \[Rule] UniformSize[.5],HeadColor\[Rule]Black]]

uaxis=Graphics3D[Arrow3D[{0,-1,0},{0,3,0},HeadSize \[Rule]
    UniformSize[.5],HeadColor\[Rule]Black]]

vaxis=Graphics3D[Arrow3D[{-1,0,0},{3,0,0},HeadSize \[Rule]
      UniformSize[.5],HeadColor\[Rule]Black]]

plane=Graphics3D[Polygon[{{1.2,1.2,0},{1.2,-1.2,0},{-1.2,-1.2,0},{-1.2,1.2,0}}\
]]

crate=WireFrame[Graphics3D[Cuboid[{1,1,0},{-1,-1,5}]]]

Show[wavefunction,xaxis,uaxis,vaxis,plane,repsi,impsi,end,crate]
Faili ajalugu
Klõpsa kuupäeva ja kellaaega, et näha sel ajahetkel kasutusel olnud failiversiooni.
| Kuupäev/kellaaeg | Pisipilt | Mõõtmed | Kasutaja | Kommentaar | |
|---|---|---|---|---|---|
| viimane | 13. veebruar 2014, kell 23:12 | 250 × 625 (11 KB) | 老陳 (arutelu | kaastöö) | Refine detail. At the top end, match red blue and black lines | |
| 13. veebruar 2014, kell 23:02 | 250 × 625 (11 KB) | 老陳 (arutelu | kaastöö) | The blue line (y component) should be above the darker blue square plate at the bottome. | ||
| 12. veebruar 2007, kell 06:36 | 250 × 625 (11 KB) | Inductiveload (arutelu | kaastöö) | |||
| 12. veebruar 2007, kell 03:18 | 250 × 625 (352 KB) | Inductiveload (arutelu | kaastöö) | {{Information |Description=Diagram of linear polarisation |Source=Own drawing down in Mathematica, edited in Inscape. |Date=12/02/07 |Author=inductiveload |Permission={PD-self} |other_versions=Circular polarisation |
Sa ei saa seda faili üle kirjutada.
Faili kasutus
Seda faili kasutavad järgmised 5 lehekülge:
_With.Phase.Indicators_Perpendicular_To_Plane.svg)
Globaalne failikasutus
Järgmised muud vikid kasutavad seda faili:
- Faili kasutus vikis bs.wikipedia.org
- Faili kasutus vikis de.wikipedia.org
- Faili kasutus vikis en.wikipedia.org
- Faili kasutus vikis es.wikipedia.org
- Faili kasutus vikis et.wikipedia.org
- Faili kasutus vikis fr.wikipedia.org
- Faili kasutus vikis fr.wikiversity.org
- Faili kasutus vikis he.wikipedia.org
- Faili kasutus vikis ko.wikipedia.org
- Faili kasutus vikis mk.wikipedia.org
- Faili kasutus vikis no.wikipedia.org
- Faili kasutus vikis ru.wikipedia.org
- Faili kasutus vikis sh.wikipedia.org
- Faili kasutus vikis tr.wikipedia.org
- Faili kasutus vikis uk.wikipedia.org
- Faili kasutus vikis vi.wikipedia.org
.svg&oldid=513693203)