File:Ramseypic.svg
Jump to navigation
Jump to search

Size of this PNG preview of this SVG file: 400 × 400 pixels. Other resolutions: 240 × 240 pixels | 480 × 480 pixels | 768 × 768 pixels | 1,024 × 1,024 pixels | 2,048 × 2,048 pixels.
Original file (SVG file, nominally 400 × 400 pixels, file size: 27 KB)
Captions
Captions
Add a one-line explanation of what this file represents
| Description |
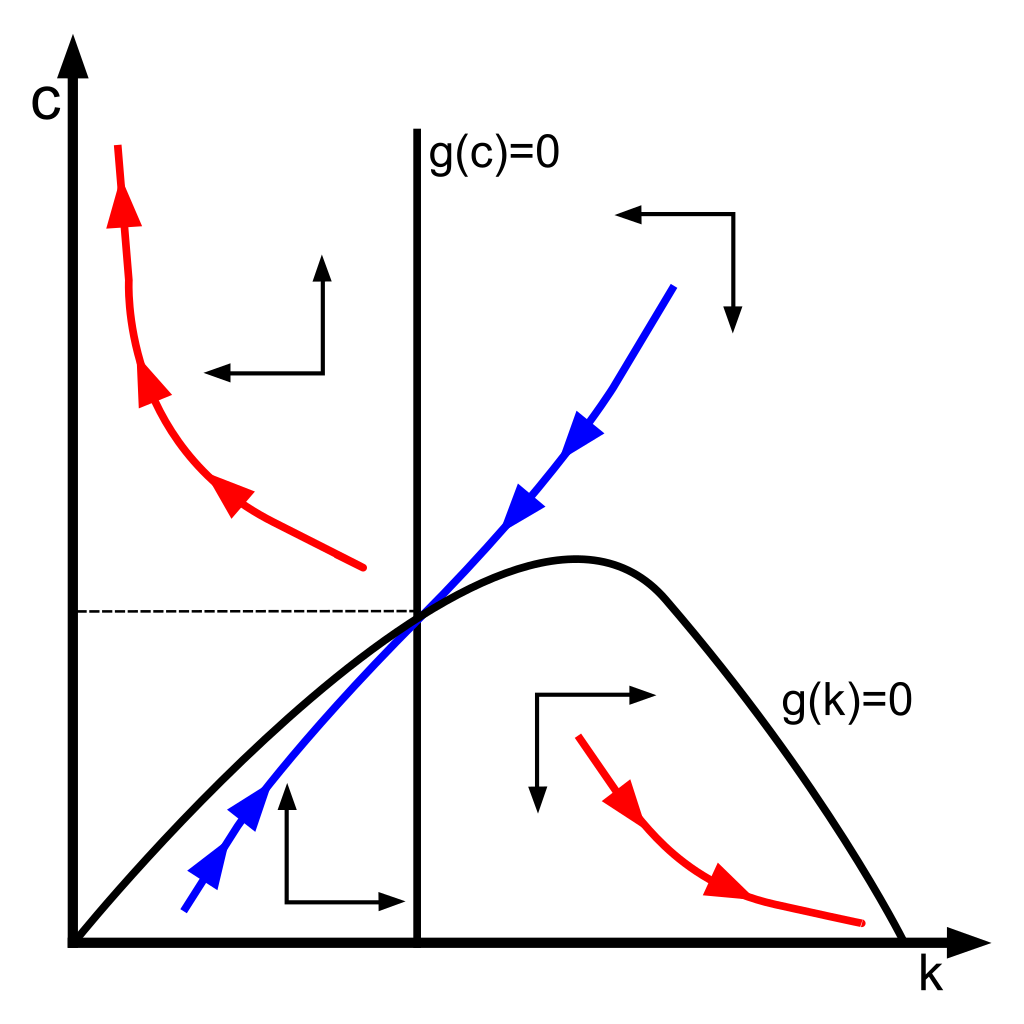
English: Ramsey growth model graph. The blue line represents the dynamic adjustment path of the economy. It is a stable path of the dynamic system. The red lines represent dynamic paths which are ruled out by the transversality condition.
Español: Gráfica del modelo de crecimiento de Ramsey. La línea azul representa la trayectoria del ajuste dinámico de la economía. Es una ruta estable del sistema dinámico. Las líneas rojas representan trayectorias dinámicas que se rigen por la condición de transversalidad. |
| Date | (UTC) |
| Source | |
| Author |
|
I, the copyright holder of this work, hereby publish it under the following licenses:
| This work has been released into the public domain by its author, [[Wikipedia:User:[[Wikipedia:User:{{{1}}}|{{{1}}}]] at English Wikipedia|[[Wikipedia:User:{{{1}}}|{{{1}}}]] at English Wikipedia]] at English Wikipedia. This applies worldwide. In some countries this may not be legally possible; if so: [[:Wikipedia:en:User:[[:Wikipedia:en:User:{{{1}}}|{{{1}}}]]|[[:Wikipedia:en:User:{{{1}}}|{{{1}}}]]]] grants anyone the right to use this work for any purpose, without any conditions, unless such conditions are required by law. |
| |
This work has been released into the public domain by its author, Example, at the [[::|English Wikipedia]] project. This applies worldwide. In case this is not legally possible: |
You may select the license of your choice.
Original upload log
[edit]
This image is a derivative work of the following images:
- File:Ramseypic-es.png licensed with PD-user-en, PD-user-w
- 2011-01-01T19:53:16Z Dalton2 2000x1800 (119465 Bytes) {{Information |Description=Ramsey growth model graph/Gráfica del modelo de crecimiento Ramsey |Source=http://en.wikipedia.org/wiki/File:Ramseypic.JPG |Date=1/1/2011 |Author=Volunteer Marek (original version), Dalton2 (new ve
Uploaded with derivativeFX
File history
Click on a date/time to view the file as it appeared at that time.
| Date/Time | Thumbnail | Dimensions | User | Comment | |
|---|---|---|---|---|---|
| current | 21:51, 1 January 2011 | | 400 × 400 (27 KB) | Rondador (talk | contribs) | ¿? |
| 21:49, 1 January 2011 |  | 400 × 400 (27 KB) | Rondador (talk | contribs) | Fixed transparency. | |
| 21:41, 1 January 2011 |  | 400 × 400 (35 KB) | Rondador (talk | contribs) | {{Information |Description={{en|1=Ramsey growth model graph. The blue line represents the dynamic adjustment path of the economy. It is a stable path of the dynamic system. The red lines represent dynamic paths which are ruled out by the transversality co |
You cannot overwrite this file.
File usage on Commons
The following page uses this file:
File usage on other wikis
The following other wikis use this file:
- Usage on de.wikipedia.org
- Usage on en.wikipedia.org
- Usage on es.wikipedia.org
- Usage on pl.wikipedia.org
- Usage on vi.wikipedia.org
- Usage on zh.wikipedia.org