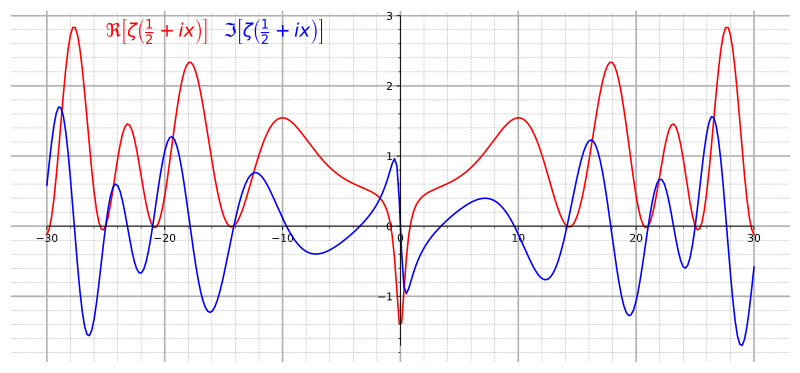
File:RiemannCriticalLine.svg
Fra Wikimedia Commons
Spring til navigation
Spring til søgning

Size of this PNG preview of this SVG file: 800 × 372 pixels. Andre opløsninger: 320 × 149 pixels | 640 × 298 pixels | 1.024 × 476 pixels | 1.280 × 595 pixels | 2.560 × 1.191 pixels | 933 × 434 pixels.
Oprindelig fil (SVG fil, basisstørrelse 933 × 434 pixels, filstørrelse: 50 KB)
File information
Structured data
Captions
Captions
Tilføj en kort forklaring på en enkelt linje om hvad filen viser
وصف حدسية ريمان
Beskrivelse[redigér]
| BeskrivelseRiemannCriticalLine.svg |
English: Graph of real (red) and imaginary (blue) parts of the critical line Re(z)=1/2 of the Riemann zeta function. |
||
| Dato | |||
| Kilde |
Own work. Made with Mathematica using the following code: Show[Plot[{Re[Zeta[1/2+I x]], Im[Zeta[1/2+I x]]}, {x,-30, 30},AxesLabel->{"x"} , PlotStyle->{Red, Blue}, Ticks->{Table[4x-28,{x,0,14}]}, ImageSize->{800,600}],
Graphics[Text[Style[\[DoubleStruckCapitalR][\[Zeta][ I x + "1/2"]],14,Red ,Background ->White],{-22,2.6} ]],
Graphics[Text[Style[\[GothicCapitalI][\[Zeta][ I x + "1/2"]],14,Blue ,Background ->White],{-14,2.6} ]]] |
||
| Forfatter | Slonzor | ||
| Tilladelse (Genbrug af denne fil) |
Public Domain | ||
| SVG udvikling InfoField | |||
| Kildekode InfoField | Python code
|
Licensering[redigér]
| Public domainPublic domainfalsefalse |
| Jeg, indehaveren af ophavsretten til dette værk, udgiver dette værk som offentlig ejendom. Dette gælder i hele verden. I nogle lande er dette ikke juridisk muligt. I så fald: Jeg giver enhver ret til at anvende dette værk til ethvert formål, uden nogen restriktioner, medmindre sådanne restriktioner er påkrævede ved lov. |
Filhistorik
Klik på en dato/tid for at se filen som den så ud på det tidspunkt.
| Dato/tid | Miniaturebillede | Dimensioner | Bruger | Kommentar | |
|---|---|---|---|---|---|
| nuværende | 23. aug. 2017, 20:01 |  | 933 × 434 (50 KB) | Krishnavedala (diskussion | bidrag) | much reduced vector version |
| 24. sep. 2009, 22:28 |  | 800 × 600 (122 KB) | Geek3 (diskussion | bidrag) | linewidth=1px | |
| 20. nov. 2008, 19:33 |  | 800 × 600 (122 KB) | Slonzor (diskussion | bidrag) | Man i've messed this up a lot of times. | |
| 20. nov. 2008, 19:27 |  | 800 × 600 (3,36 MB) | Slonzor (diskussion | bidrag) | ||
| 20. nov. 2008, 19:23 |  | 800 × 600 (3,36 MB) | Slonzor (diskussion | bidrag) | ||
| 20. nov. 2008, 19:18 |  | 800 × 600 (3,36 MB) | Slonzor (diskussion | bidrag) | ||
| 20. nov. 2008, 19:13 |  | 800 × 600 (79 KB) | Slonzor (diskussion | bidrag) | {{Information |Description={{en|1=Graph of real (red) and imaginary (blue) parts of the critical line Re(z)=1/2 of the Riemann zeta function.}} |Source=Own work. Made with Mathematica using the following code: <code><nowiki>Show[Plot[{Re[Zeta[1/2+I x]], |
Du kan ikke overskrive denne fil.
Filanvendelse
Den følgende side bruger denne fil:
Global filanvendelse
Følgende andre wikier anvender denne fil:
- Anvendelser på ar.wikipedia.org
- Anvendelser på ba.wikipedia.org
- Anvendelser på be.wikipedia.org
- Anvendelser på ca.wikipedia.org
- Anvendelser på ckb.wikipedia.org
- Anvendelser på da.wikipedia.org
- Anvendelser på el.wikipedia.org
- Anvendelser på en.wikipedia.org
- Anvendelser på eo.wikipedia.org
- Anvendelser på eu.wikipedia.org
- Anvendelser på fa.wikipedia.org
- Anvendelser på fi.wikipedia.org
- Anvendelser på he.wikipedia.org
- Anvendelser på hi.wikipedia.org
- Anvendelser på hy.wikipedia.org
- Anvendelser på id.wikipedia.org
- Anvendelser på it.wikipedia.org
- Anvendelser på it.wikiquote.org
- Anvendelser på ja.wikipedia.org
- Anvendelser på ko.wikipedia.org
- Anvendelser på la.wikipedia.org
- Anvendelser på mn.wikipedia.org
- Anvendelser på nn.wikipedia.org
- Anvendelser på no.wikipedia.org
- Anvendelser på pa.wikipedia.org
- Anvendelser på pt.wikipedia.org
- Anvendelser på ru.wikipedia.org
- Anvendelser på sl.wikipedia.org
- Anvendelser på sq.wikipedia.org
- Anvendelser på sr.wikipedia.org
- Anvendelser på uk.wikipedia.org
- Anvendelser på vi.wikipedia.org
- Anvendelser på zh-yue.wikipedia.org
Vis flere globale anvendelser af denne fil.
Metadata
Denne fil indeholder yderligere informationer, sandsynligvis tilføjet af digitalkameraet eller den skanner som blev brugt til at oprette eller digitalisere den. Hvis filen er ændret fra sin oprindelige tilstand, afspejler nogle detaljer muligvis ikke den ændrede fil.
| Bredde | 746pt |
|---|---|
| Længde | 347pt |